Multicore Examples on FRDM-MCXN947 and MCUXpresso SDK 24.12
The following are required to follow this chapter:
MCUXpresso for VS Code v1.0 or later
FRDM-MCXN947 development board
MCUXpresso SDK GitHub repository 25.03 or later
Overview
The MCX N94x series of MCUs contains a main or ‘primary’ Cortex-M33 core, plus a ‘secondary’ Cortex-M33 core (with reduced functionality).
On devices with both cores implemented, after a power-on or reset, the primary core starts executing, but the secondary core is held in reset (that is, its code does not start to execute). Code running on the primary core is then responsible for releasing the secondary core from reset; hence the names primary and secondary. In reality, primary and secondary only apply to the booting process; after boot, your application may treat either of the cores as the primary or secondary.
MCUXpresso for VS Code provides highly flexible support for creating and debugging MCX N947 applications, for both single-core and multicore systems. This article details the process of creating and debugging such multicore applications. Note that it is assumed you are familiar with standard MCUXpresso for VS Code behavior, such as downloading and installing an appropriate MCUXpresso SDK for an MCU and importing examples from the SDK. For more details of these and other operations, see the MCUXpresso for VS Code User Guide. The User Guide also provides more general information on multicore projects and debugging.
Importing a multicore example project
As a prerequisite, use MCUXpresso Installer to install the ARM GNU toolchain component plus a Debug Probe software dedicated for your available debug probe (LinkServer, SEGGER J-Link, or PEmicro).
From the Quickstart Panel, select Import Example from Repository, then select the imported repository, toolchain, and the FRDM-MCXN947 board.
In the Choose a template section, type “multicore”. The filter then displays only the examples containing the word “multicore”. Select either of the Hello World projects.
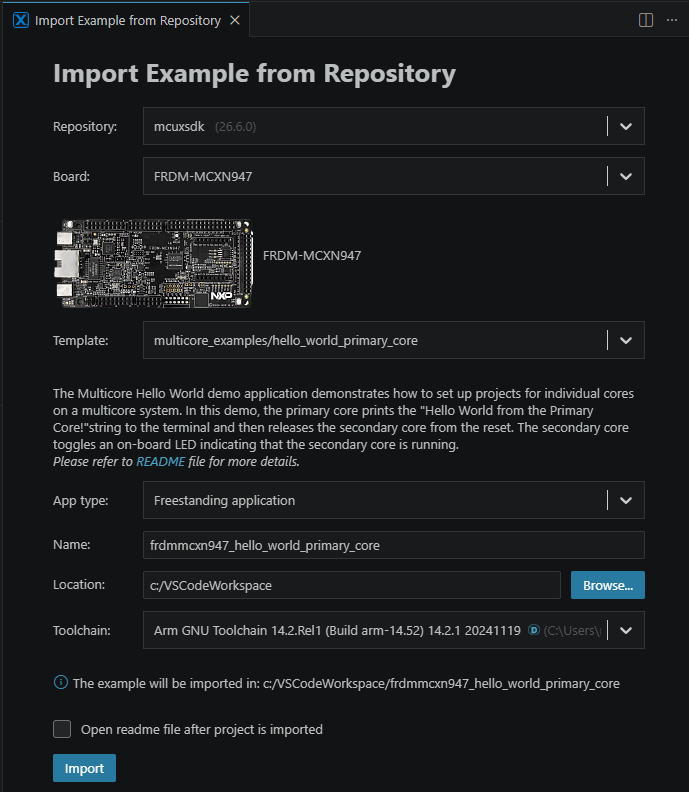
After selecting the appropriate multicore example project, click Import to create the project in your workspace. The import process automatically adds the project to the Projects view and configures the necessary settings for a multicore application targeting the FRDM-MCXN947 board.
Notes about Multicore project contents and configuration
There are several important aspects of the project created using the steps above.
The secondary core project generates a binary file in a post-build step:

The secondary core image is loaded as a binary file:
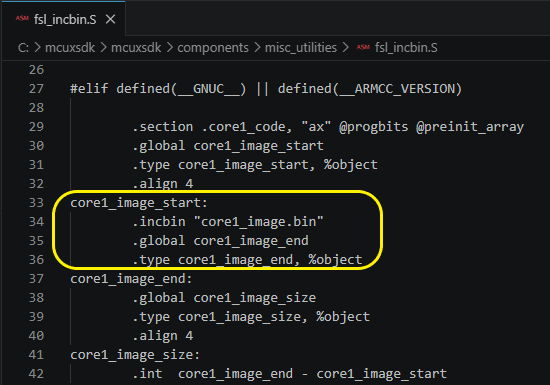
The main() routine in the primary project contains a code sequence that copies the secondary core image from flash memory to the target RAM memory and then boots the secondary core application.

Building a multicore application
The simplest way to build a multicore project is to trigger a build using the Build option from the toolbar of the project.

Since the application spans multiple domains - one for the primary core and another for the secondary core - the build process starts by compiling the code of the secondary core. Once that is completed, the code of the primary core is built, embedding a copy of the secondary project’s image into the final image produced for the primary project, as illustrated above.
Upon completion of the build process, the tool generates the executable and displays an exit code of 0 in the Output console, indicating a successful build.

Debugging a multicore application
Having built your simple multicore application, you can now debug it.
Note: In the debug example below, we use the on-board “MCU-Link” debug probe on the FRDM-MCXN947 board. However, the details are the same if using a standalone “MCU-Link” debug probe. This chapter does not cover the use of a PEmicro or SEGGER J-Link probe. For general information on using these probes, see the debug documentation.
First of all, start a debug session for the primary domain (core) using the Debug option on the toolbar of the project.
Once in debug, the core #0 execution stops at main.
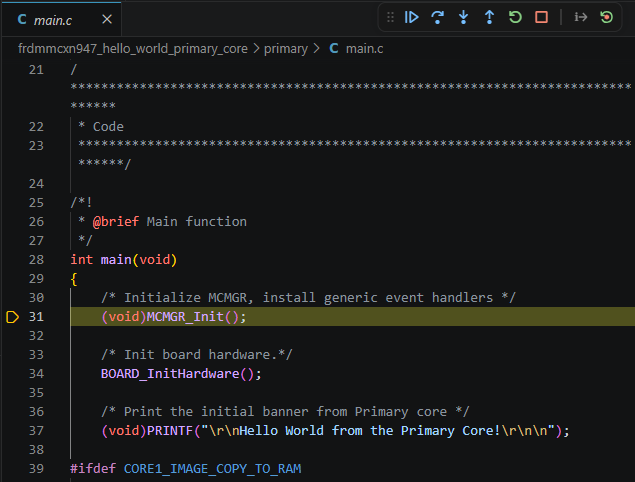
Since core #0 is responsible for initializing core #1, you need to start executing the core #0 application. Select Continue from the debug toolbar, allow 1-2 seconds for execution, then press it again to stop the execution.

Core 1 is expected to be initialized at this stage.
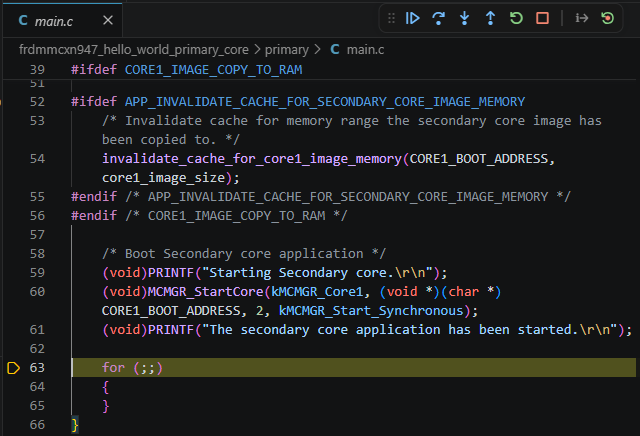
At this point, expand the Domains node in the Projects view and use the Debug option to start the debug session for the secondary core.
Note: For multicore imported projects, the debug session for the secondary core only attaches to the second core, since no additional download is needed.

Once the second debug session has started, more than a single debug session is available in VS Code. The debug toolbar indicates this by showing a debug session selector.

Selecting one entry from the list switches the available debug context to that debug session. The two debug sessions and their execution call stack status can also be visualized in the Call Stack view in the Run and Debug view. Selecting a call from that view switches to the desired core debug context.
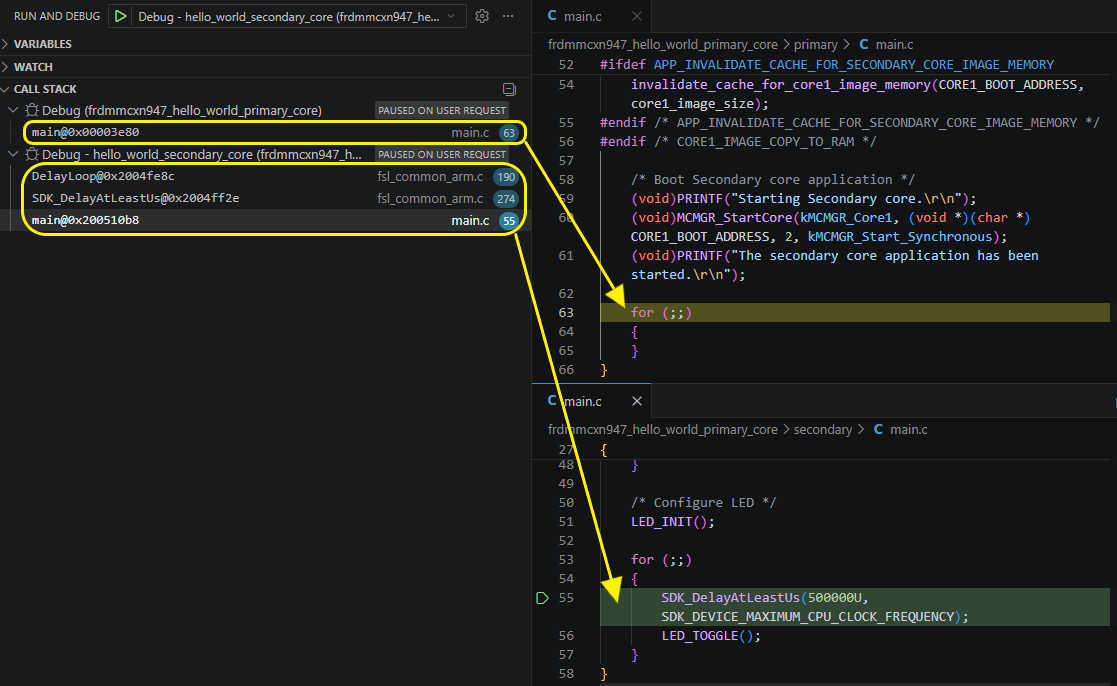
All the other debug views (Variables, Registers, Peripherals, and so on) change their content according to the selected debug context.
After starting a debug session, you can use the Terminate Debug button to terminate all debug sessions associated with that project.

You can terminate a debug session for a certain domain using the dedicated button.
