Run an example application
This section describes steps to run a demo application using J-Link GDB Server application. To perform this exercise, two things must be done:
Make sure that either:
The OpenSDA interface on your board is programmed with the J-Link OpenSDA firmware. To determine if your board supports OpenSDA, see Default debug interfaces. For instructions on reprogramming the OpenSDA interface, see Updating debugger firmware. If your board does not support OpenSDA, a standalone J-Link pod is required.
You have a standalone J-Link pod that is connected to the debug interface of your board. Note that some hardware platforms require hardware modification in order to function correctly with an external debug interface.
After the J-Link interface is configured and connected, follow these steps to download and run the demo applications:
Connect the development platform to your PC via USB cable between the OpenSDA USB connector (may be named OSJTAG for some boards) and the PC USB connector. If using a standalone J-Link debug pod, also connect it to the SWD/JTAG connector of the board.
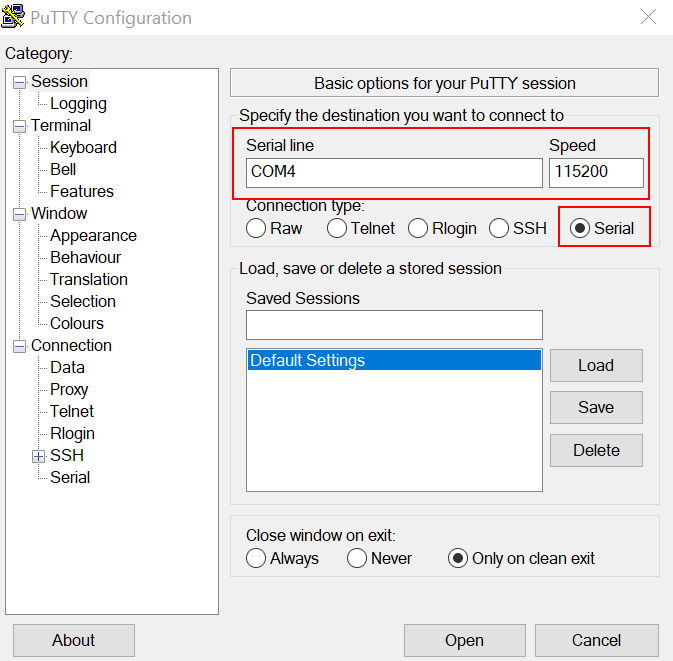
Open the terminal application on the PC, such as PuTTY or TeraTerm, and connect to the debug serial port number (to determine the COM port number, see How to determine COM port. Configure the terminal with these settings:
115200 or 9600 baud rate, depending on your board (reference
BOARD_DEBUG_UART_BAUDRATEvariable in theboard.hfile)No parity
8 data bits
1 stop bit
|
|
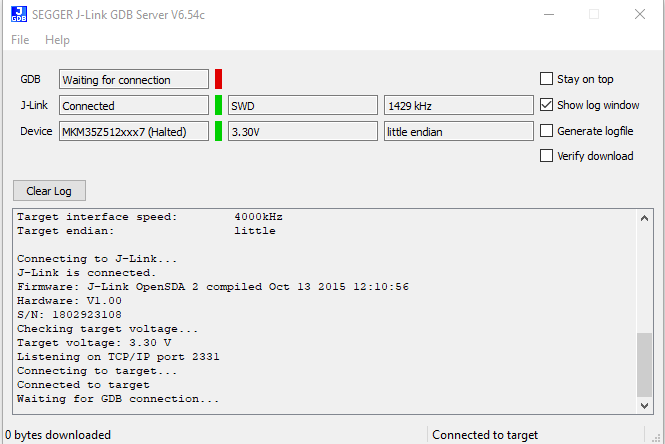
Open the J-Link GDB Server application. Assuming the J-Link software is installed, the application can be launched by going to the Windows operating system Start menu and selecting Programs -> SEGGER -> **J-Link <version>**J-Link GDB Server.
Modify the settings as shown below. The target device selection chosen for this example is MKM35Z512xxx7.
After it is connected, the screen should resemble Figure 2:
|
|
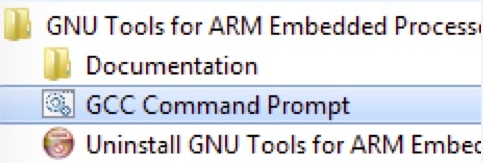
If not already running, open a GCC Arm Embedded tool chain command window. To launch the window, from the Windows operating system Start menu, go to Programs -> GNU Tools Arm Embedded <version> and select GCC Command Prompt.
|
|
Change to the directory that contains the example application output. The output can be found in using one of these paths, depending on the build target selected:
<install_dir>/boards/<board_name>/<example_type>/<application_name>/armgcc/debug
<install_dir>/boards/<board_name>/<example_type>/<application_name>/armgcc/release
For this example, the path is:
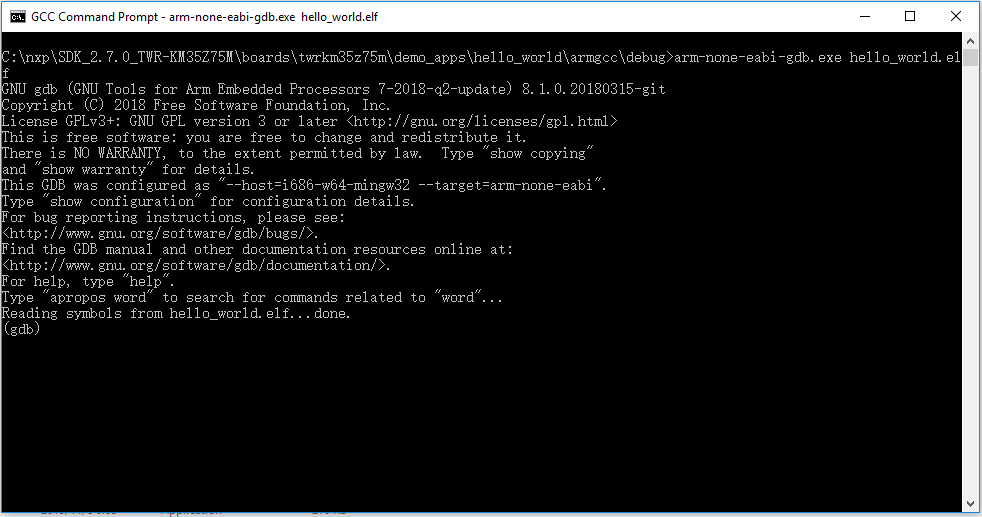
<install_dir>/boards/twrkm35z75m/demo_apps/hello_world/armgcc/debug
Run the
arm-none-eabi-gdb.exe <application_name>.elfcommand. For this example, it isarm-none-eabi-gdb.exe hello_world.elf.|
|
Run these commands:
target remote localhost:2331monitor resetmonitor haltloadmonitor reset
The application is now downloaded and halted at the reset vector. Execute the
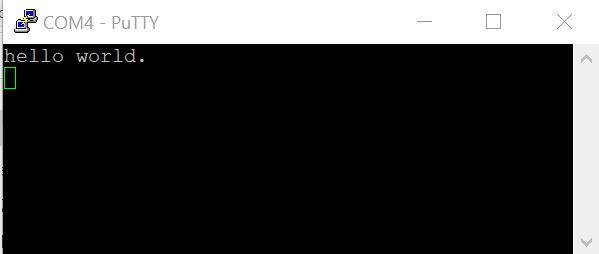
monitor gocommand to start the demo application.The
hello_worldapplication is now running and a banner is displayed on the terminal. If this is not true, check your terminal settings and connections.|
|
Parent topic:Run a demo using Arm GCC