Run an example application
To download and run the application, perform the following steps:
See Table 1 to determine the debug interface that comes loaded on your specific hardware platform.
Connect the development platform to your PC via a USB cable.
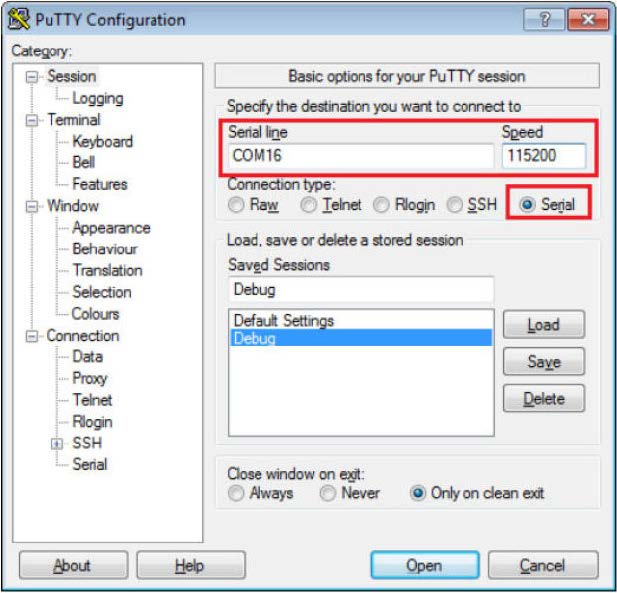
Open the terminal application on the PC, such as PuTTY or TeraTerm, and connect to the debug serial port number. To determine the COM port number, see How to determine COM port. Configure the terminal with these settings:
115200 or 9600 baud rate, depending on your board (reference
BOARD_DEBUG_UART_BAUDRATEvariable in the board.h file)No parity
8 data bits
1 stop bit
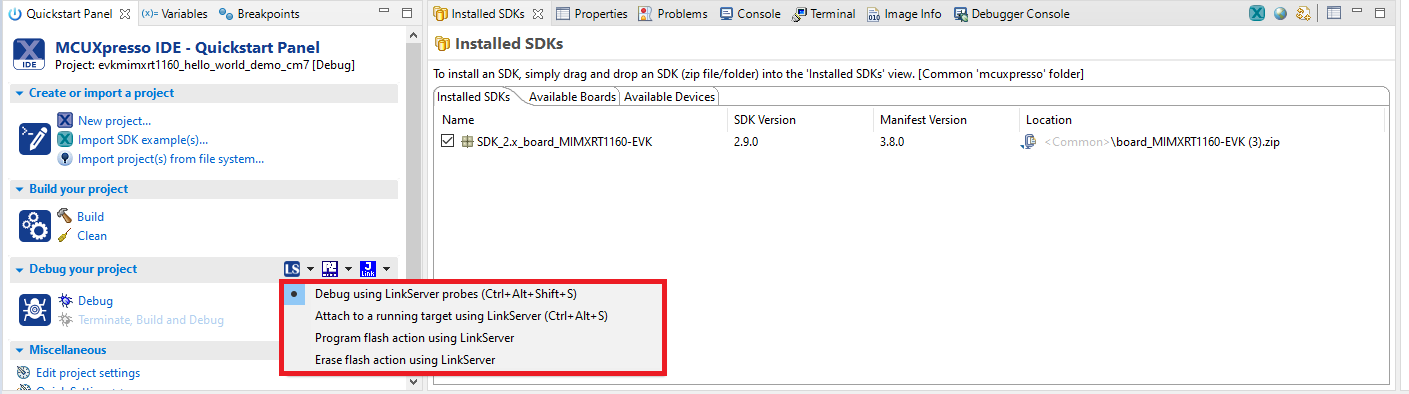
On the Quickstart Panel, click Debug ‘evkmimxrt1160_demo_apps_hello_world’ [Debug].
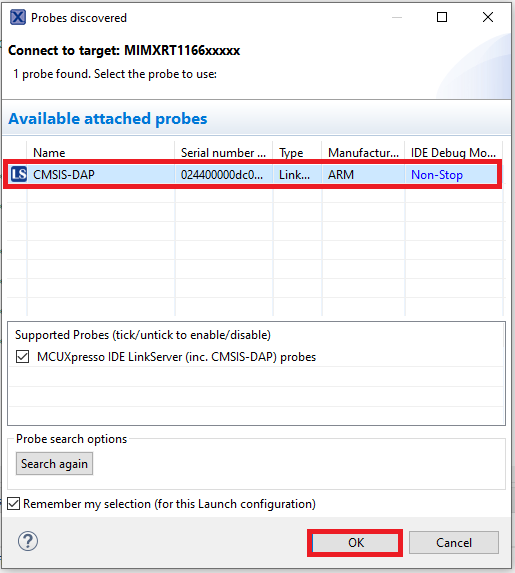
The first time you debug a project, the Debug Emulator Selection dialog is displayed, showing all supported probes that are attached to your computer. Select the probe through which you want to debug and click OK. (For any future debug sessions, the stored probe selection is automatically used, unless the probe cannot be found.)
The application is downloaded to the target and automatically runs to
main().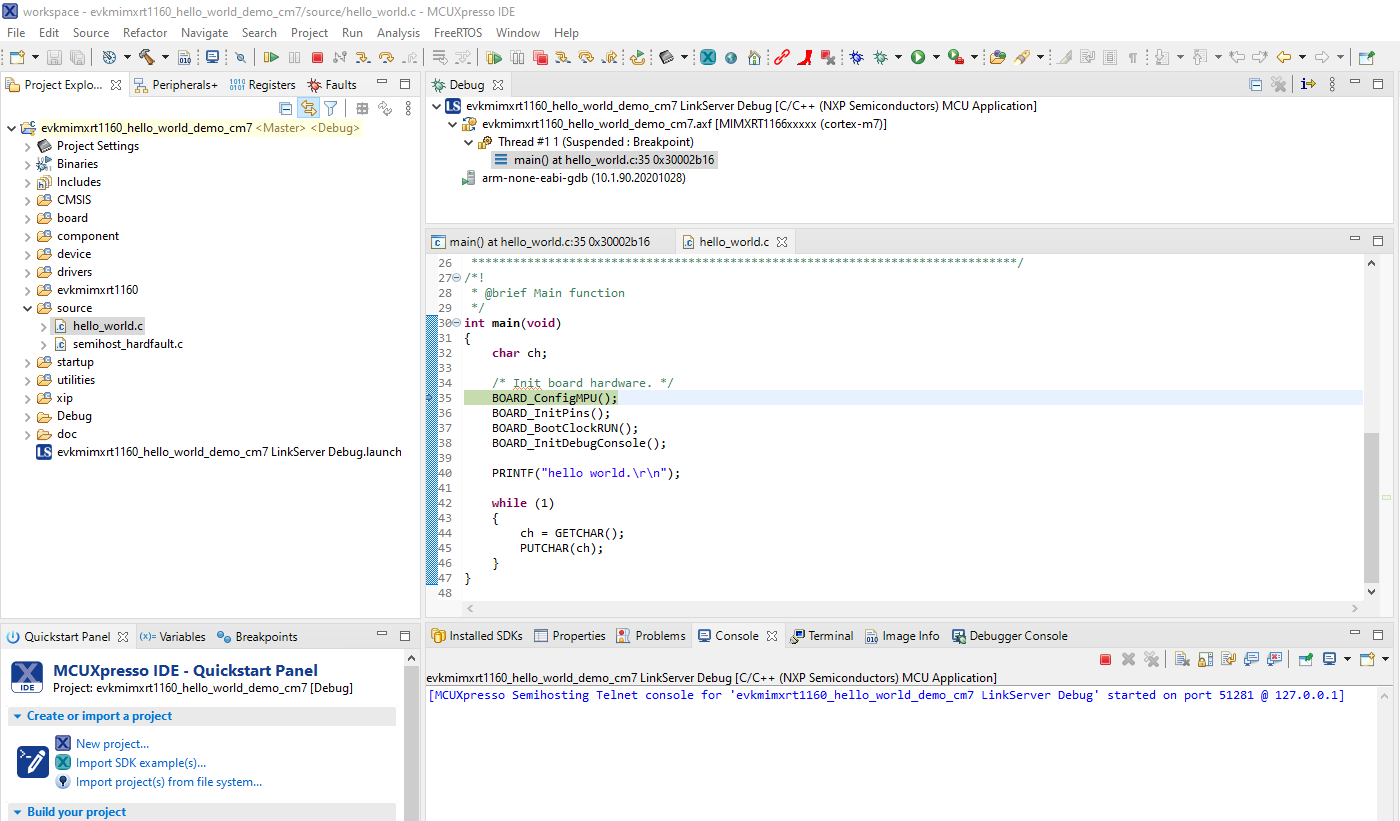
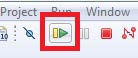
Start the application by clicking Resume.
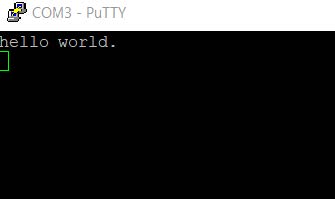
The hello_world application is now running and a banner is displayed on the terminal. If this is not the case, check your terminal settings and connections.
Parent topic:Run a demo using MCUXpresso IDE