Run a demo using Arm GCC
This section describes the steps to configure the command-line Arm GCC tools to build, run, and debug demo applications and necessary driver libraries provided in the MCUXpresso SDK. The hello_world demo application is targeted which is used as an example.
Set up toolchain
This section contains the steps to install the necessary components required to build and run an MCUXpresso SDK demo application with the Arm GCC toolchain, as supported by the MCUXpresso SDK. There are many ways to use Arm GCC tools, but this example focuses on a Windows operating system environment.
Install GCC Arm Embedded tool chain
Download and run the installer from GNU Arm Embedded Toolchain. This is the actual toolset (in other words, compiler, linker, and so on). The GCC toolchain should correspond to the latest supported version, as described in MCUXpresso SDK Release Notes.
Parent topic:Set up toolchain
Install MinGW (only required on Windows OS)
The Minimalist GNU for Windows (MinGW) development tools provide a set of tools that are not dependent on third-party C-Runtime DLLs (such as Cygwin). The build environment used by the MCUXpresso SDK does not use the MinGW build tools, but does leverage the base install of both MinGW and MSYS. MSYS provides a basic shell with a Unix-like interface and tools.
Download the latest MinGW mingw-get-setup installer from MinGW.
Run the installer. The recommended installation path is
C:\MinGW, however, you may install to any location.Note: The installation path cannot contain any spaces.
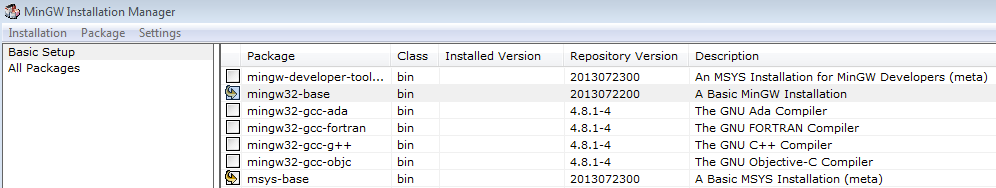
Ensure that the mingw32-base and msys-base are selected under Basic Setup.
|
|
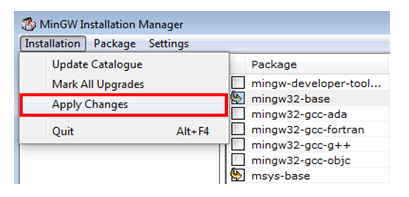
In the Installation menu, click Apply Changes and follow the remaining instructions to complete the installation.
|
|
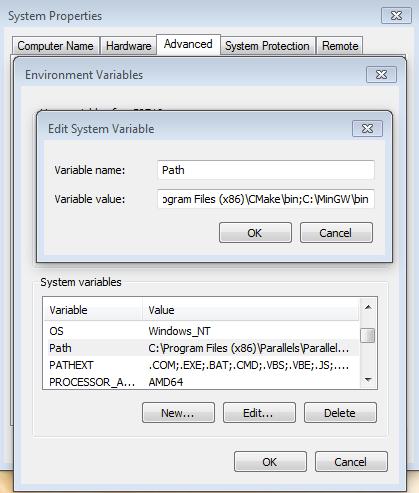
Add the appropriate item to the Windows operating system path environment variable. It can be found under Control Panel->System and Security->System->Advanced System Settings in the Environment Variables… section. The path is:
<mingw_install_dir>\bin
Assuming the default installation path,
C:\MinGW, an example is shown below. If the path is not set correctly, the toolchain will not work.Note: If you have
C:\MinGW\msys\x.x\binin your PATH variable (as required by Kinetis SDK 1.0.0), remove it to ensure that the new GCC build system works correctly.|
|
Parent topic:Set up toolchain
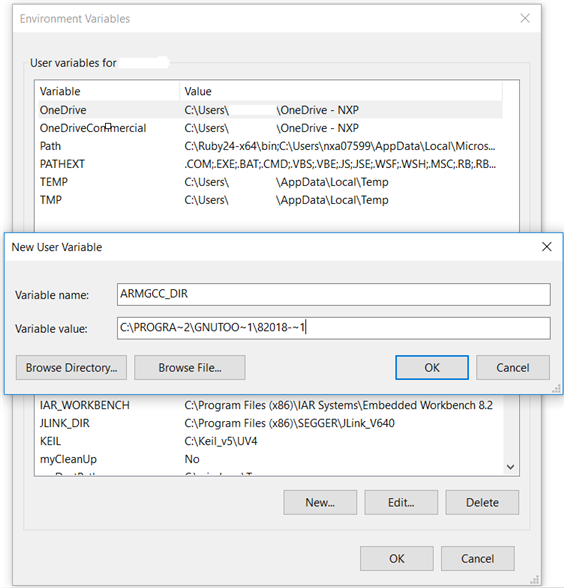
Add a new system environment variable for ARMGCC_DIR
Create a new system environment variable and name it as ARMGCC_DIR. The value of this variable should point to the Arm GCC Embedded tool chain installation path. For this example, the path is:
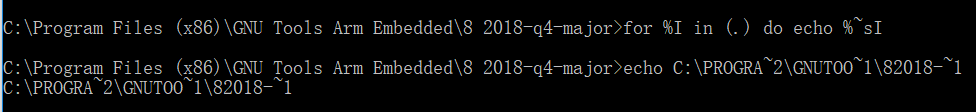
C:\Program Files (x86)\GNU Tools Arm Embedded\8 2018-q4-major
See the installation folder of the GNU Arm GCC Embedded tools for the exact pathname of your installation.
Short path should be used for path setting, you could convert the path to short path by running command for %I in (.) do echo %~sI in above path.
|
|
|
|
Parent topic:Set up toolchain
Install CMake
Download CMake 3.0.x from www.cmake.org/cmake/resources/software.html.
Install CMake, ensuring that the option Add CMake to system PATH is selected when installing. The user chooses to select whether it is installed into the PATH for all users or just the current user. In this example, it is installed for all users.
|

|
Follow the remaining instructions of the installer.
You may need to reboot your system for the PATH changes to take effect.
Make sure
sh.exeis not in the Environment Variable PATH. This is a limitation ofmingw32-make.
Parent topic:Set up toolchain
Parent topic:Run a demo using Arm GCC
Build an example application
To build an example application, follow these steps.
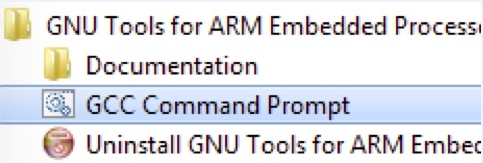
Open a GCC Arm Embedded tool chain command window. To launch the window, from the Windows operating system Start menu, go to Programs >GNU Tools Arm Embedded <version> and select GCC Command Prompt.
|
|
Change the directory to the example application project directory which has a path similar to the following:
<install_dir>/boards/<board_name>/<example_type>/<application_name>/armgcc
For this example, the exact path is:
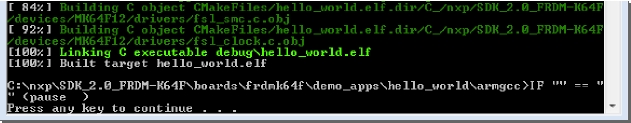
Note: To change directories, use the
cdcommand.Type build_debug.bat on the command line or double click on build_debug.bat file in Windows Explorer to build it. The output is as shown in Figure 2.
|
|
Parent topic:Run a demo using Arm GCC
Run an example application
This section describes steps to run a demo application using J-Link GDB Server application. To update the onboard LPC-Link2 debugger to Jlink firmware, see Updating debugger firmware.
Note: J-Link GDB Server application is not supported for TFM examples. Use CMSIS DAP instead of J-Link for flashing and debugging TFM examples.
After the J-Link interface is configured and connected, follow these steps to download and run the demo applications:
Connect the development platform to your PC via USB cable between the LPC-Link2 USB connector (may be named OSJTAG for some boards) and the PC USB connector. If using a standalone J-Link debug pod, connect it to the SWD/JTAG connector of the board.
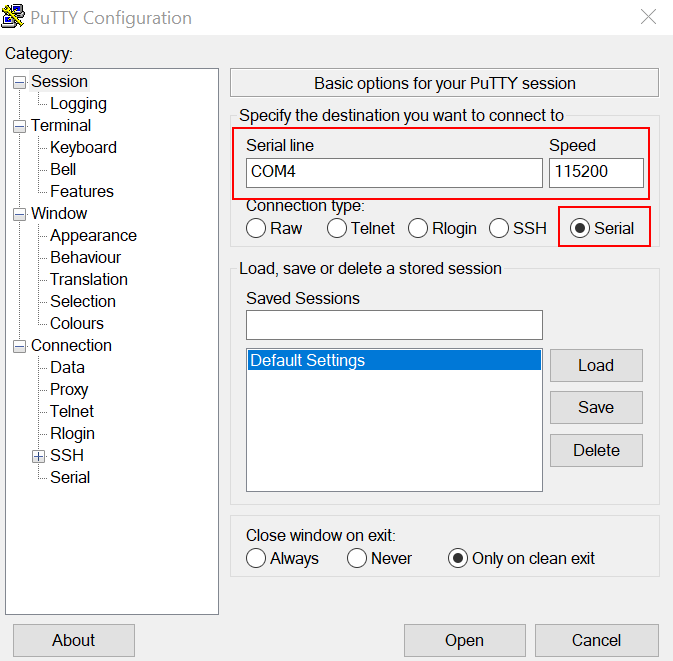
Open the terminal application on the PC, such as PuTTY or TeraTerm, and connect to the debug serial port number (to determine the COM port number, see How to determine COM port). Configure the terminal with these settings:
115200 or 9600 baud rate, depending on your board (reference
BOARD_DEBUG_UART_BAUDRATEvariable inboard.hfile)No parity
8 data bits
1 stop bit
|
|
**Note:** Make sure that the board is set to FlexSPI flash boot mode \(ISP2: ISP1: ISP0 = ON, OFF, ON\) before use GDB debug.
To launch the application, open the Windows Start menu and select Programs > SEGGER > J-Link <version> J-Link GDB Server.
Note: It is assumed that the J-Link software is already installed.
The SEGGER J-Link GDB Server Config settings dialog appears.
Make sure to check the following options.
Target interface: The debug connection on board uses internal SWD signaling. In case of a wrong setting J-Link is unable to communicate with device under test.
Script file: If required, a J-Link init script file can be used for board initialization. The file with the “
.jlinkscript” file extension is located in the<install_dir>/boards/<board_name>/directory.Under the Server settings, check the GDB port for connection with the gdb target remote command. For more information, see step 9.
There is a command line version of J-Link GDB server “
JLinkGDBServerCL.exe”. Typical path isC:\Program Files\SEGGER\JLink\. To start the J-Link GDB server with the same settings as are selected in the UI, you can use these command line options.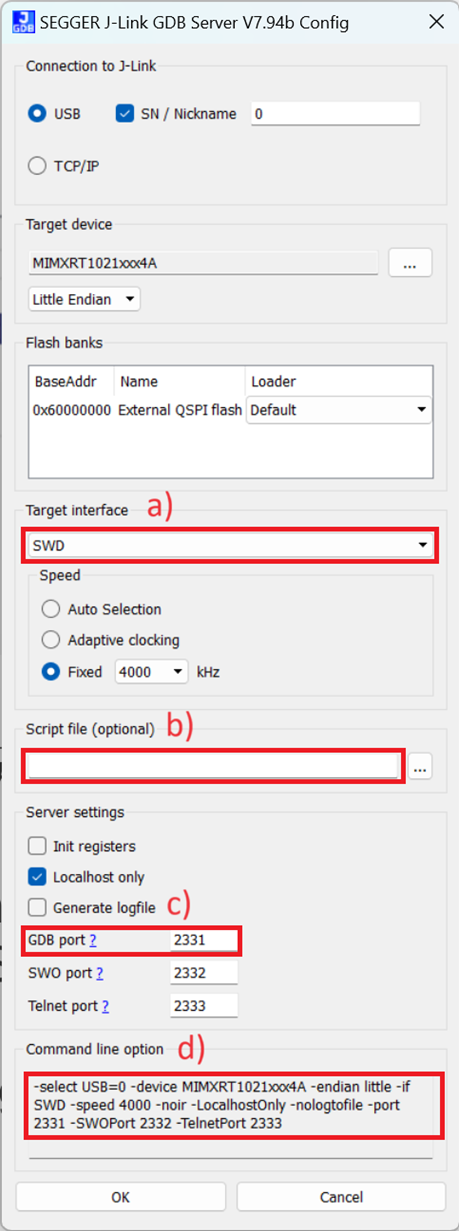
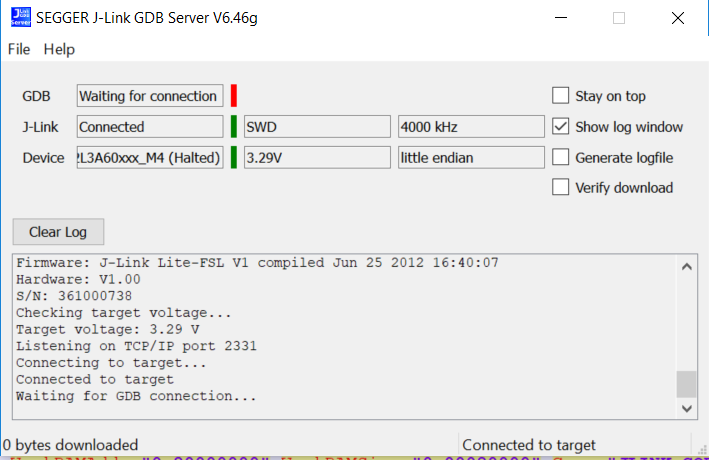
After it is connected, the screen should look like this figure:
|
|
If not already running, open a GCC Arm Embedded tool chain command window. To launch the window, from the Windows operating system Start menu, go to Programs - GNU Tools Arm Embedded <version> and select GCC Command Prompt.
|
|
Change to the directory that contains the example application output. The output can be found in using one of these paths, depending on the build target selected:
<install_dir>/boards/<board_name>/<example_type>/<application_name>/armgcc/debug
<install_dir>/boards/<board_name>/<example_type>/<application_name>/armgcc/release
For this example, the path is:
<install_dir>/boards/frdmk32l3a6/demo_apps/hello_world/cm4/armgcc/debug
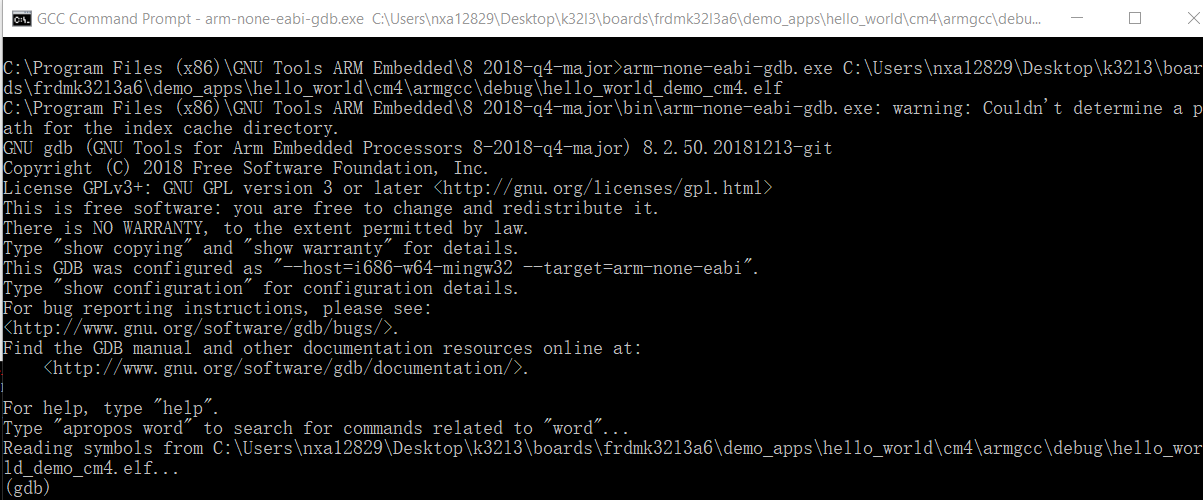
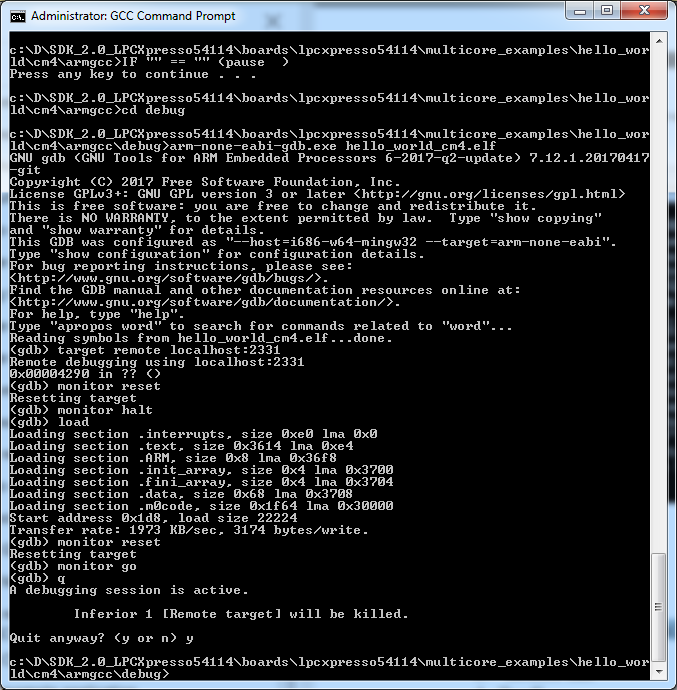
Run the
arm-none-eabi-gdb.exe <application_name>.elfcommand. For this example, it isarm-none-eabi-gdb.exe hello_world.elf.|
|
Run these commands:
target remote localhost:2331monitor resetmonitor haltloadmonitor reset
The application is now downloaded and halted at the watchpoint. Execute the
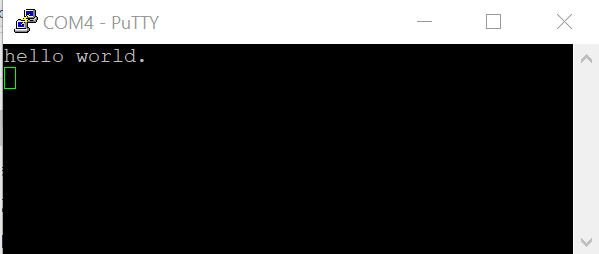
monitor gocommand to start the demo application.The
hello_worldapplication is now running and a banner is displayed on the terminal. If this does not appear, check your terminal settings and connections.|
|
Parent topic:Run a demo using Arm GCC
Build a multicore example application
This section describes the steps to build and run a dual-core application. The demo application build scripts are located in this folder:
<install_dir>/boards/<board_name>/multicore_examples/<application_name>/<core_type>/armgcc
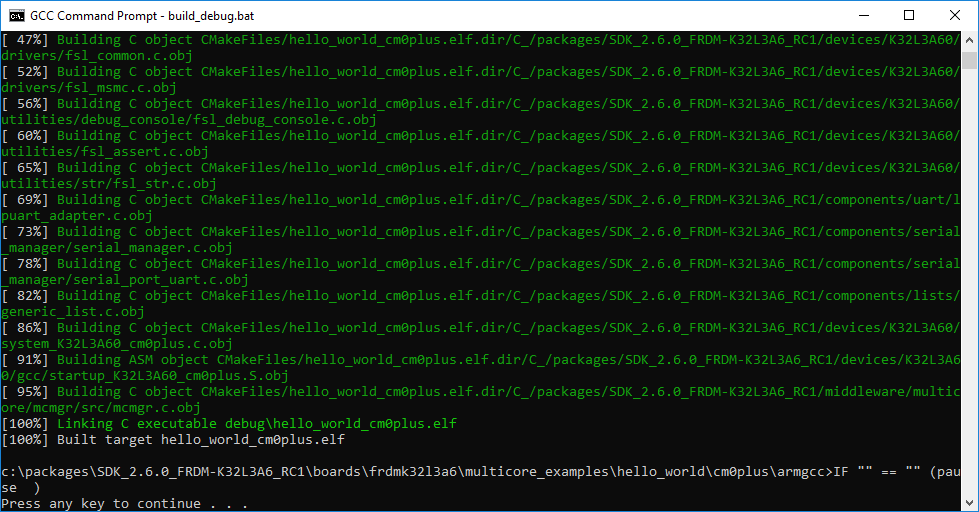
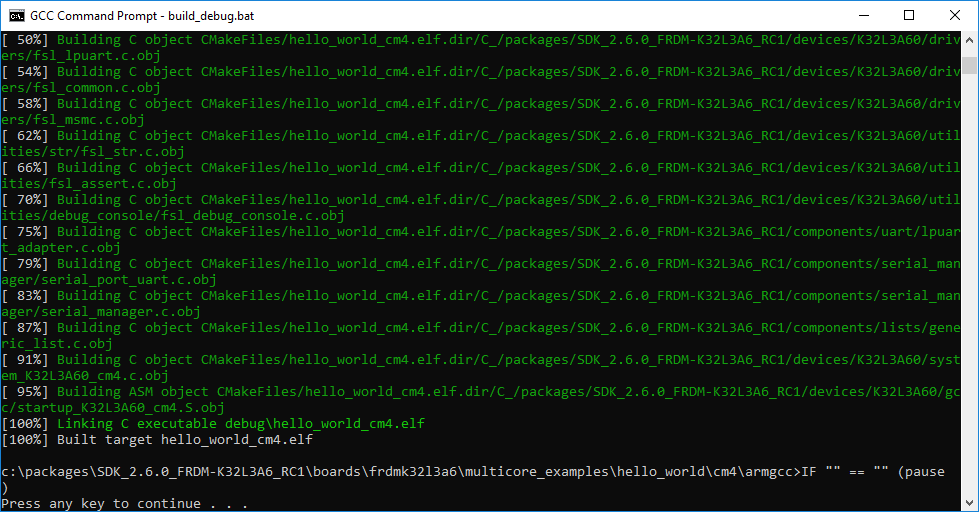
Begin with a simple dual-core version of the Hello World application. The multicore Hello World GCC build scripts are located in this folder:
<install_dir>/boards/lpcxpresso54114/multicore_examples/hello_world/cm0plus/armgcc/build_debug.bat
<install_dir>/boards/lpcxpresso54114/multicore_examples/hello_world/cm4/armgcc/build_debug.bat
Build both applications separately following steps for single core examples as described in Build an example application.
|
|
|
|
Parent topic:Run a demo using Arm GCC
Run a multicore example application
When running a multicore application, the same prerequisites for J-Link/J-Link OpenSDA firmware, and the serial console as for the single-core application, applies, as described in Run an example application.
The primary core debugger handles flashing of both the primary and the auxiliary core applications into the SoC flash memory. To download and run the multicore application, switch to the primary core application project and perform steps 1 to 10, as described in Run an example application. These steps are common for both single-core and dual-core applications in Arm GCC.
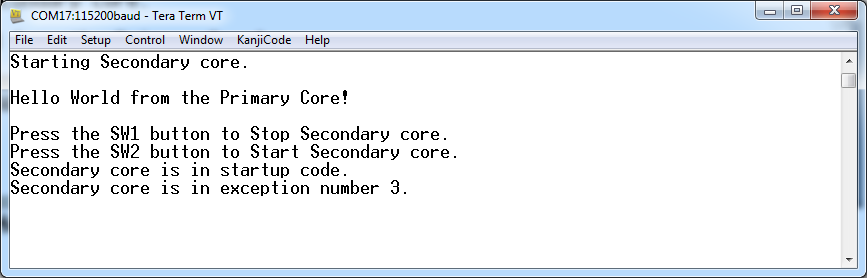
Both the primary and the auxiliary image is loaded into the SPI flash memory. After execution of the monitor go command, the primary core application is executed. During the primary core code execution, the auxiliary core code is reallocated from the flash memory to the RAM, and the auxiliary core is released from the reset. The hello_world multicore application is now running and a banner is displayed on the terminal. If this is not true, check your terminal settings and connections.
|
|
|
|
Parent topic:Run a demo using Arm GCC