Run a demo using Arm GCC
This section describes the steps to configure the command line Arm GCC tools to build, run, and debug demo applications and necessary driver libraries provided in the MCUXpresso SDK. The hello_world demo application targeted for i.MX 8M Nano is used as an example, though these steps can be applied to any board, demo or example application in the MCUXpresso SDK.
Linux OS host
The following sections provide steps to run a demo compiled with Arm GCC on Linux host.
Set up toolchain
This section contains the steps to install the necessary components required to build and run a MCUXpresso SDK demo application with the Arm GCC toolchain, as supported by the MCUXpresso SDK.
Install GCC Arm embedded tool chain
Download and run the installer from launchpad.net/gcc-arm-embedded. This is the actual toolset (in other words, compiler, linker, and so on). The GCC toolchain should correspond to the latest supported version, as described in the MCUXpresso SDK Release Notes (document MCUXSDKRN).
Note: See Host setup for Linux OS before compiling the application.
Parent topic:Set up toolchain
Add a new system environment variable for ARMGCC_DIR
Create a new system environment variable and name it ARMGCC_DIR. The value of this variable should point to the Arm GCC Embedded tool chain installation path. For this example, the path is:
$ export ARMGCC_DIR=/work/platforms/tmp/gcc-arm-none-eabi-8-2018-q4-major
$ export PATH= $PATH:/work/platforms/tmp/gcc-arm-none-eabi-8-2018-q4-major/bin
Parent topic:Set up toolchain
Parent topic:Linux OS host
Build an example application
To build an example application, follow these steps.
Change the directory to the example application project directory, which has a path similar to the following:
<install_dir>/boards/<board_name>/<example_type>/<application_name>/armgccFor this example, the exact path is:
<install_dir>/boards/evkmimx8mn/demo_apps/hello_world/armgccRun the
build_debug.shscript on the command line to perform the build. The output is shown as below:$ ./build_debug.sh -- TOOLCHAIN_DIR: /work/platforms/tmp/gcc-arm-none-eabi-8-2018-q4-major -- BUILD_TYPE: debug -- TOOLCHAIN_DIR: /work/platforms/tmp/gcc-arm-none-eabi-8-2018-q4-major -- BUILD_TYPE: debug -- The ASM compiler identification is GNU -- Found assembler: /work/platforms/tmp/gcc-arm-none-eabi-9-2019-q4-major/bin/arm-none-eabi-gcc -- Configuring done -- Generating done -- Build files have been written to: /work/platforms/tmp/nxp/SDK\_2.6.0\_EVK\_MIMX8MN/boards/evkmimx8mn/demo\_apps/hello\_world/armgcc Scanning dependencies of target hello_world.elf \[ 6%\] Building C object CMakeFiles/hello\_world.elf.dir/work/platforms/tmp/nxp/SDK\_2.6.0\_EVK\_MIMX8MN/boards/evkmimx8mn/demo\_apps/hello\_world/hello\_world.c.obj < -- skipping lines -- > [100%] Linking C executable debug/hello_world.elf [100%] Built target hello_world.elf
Parent topic:Linux OS host
Run an example application
This section describes steps to run a demo application using J-Link GDB Server application.
After the J-Link interface is configured and connected, follow these steps to download and run the demo applications:
Connect the development platform to your PC via USB cable between the USB-UART connector and the PC USB connector. If using a standalone J-Link debug pod, also connect it to the SWD/JTAG connector of the board.
Open the terminal application on the PC, such as PuTTY or TeraTerm, and connect to the debug serial port number (to determine the COM port number, see How to determine COM port). Configure the terminal with these settings:
115200 baud rate, depending on your board (reference
BOARD_DEBUG_UART_BAUDRATEvariable in theboard.hfile)No parity
8 data bits
1 stop bit
|
|
Open the J-Link GDB Server application. Assuming the J-Link software is installed, the application can be launched from a new terminal for the MIMX8MN_M7 device:
$ JLinkGDBServer -if JTAG -device
SEGGER J-Link GDB Server  Command Line Version
JLinkARM.dll
Command line: -if JTAG -device MIMX8MN6\_M7
-----GDB Server start settings-----
GDBInit file: none
GDB Server Listening port: 2331
SWO raw output listening port: 2332
Terminal I/O port: 2333
Accept remote connection: yes
< -- Skipping lines -- >
Target connection timeout: 0 ms
------J-Link related settings------
J-Link Host interface: USB
J-Link script: none
J-Link settings file: none
------Target related settings------
Target device:
Target interface: JTAG
Target interface speed: 1000 kHz
Target endian: little
Connecting to J-Link...
J-Link is connected.
Firmware: J-Link V10 compiled Feb 2 2018 18:12:40
Hardware: V10.10
S/N: 600109545
Feature(s): RDI, FlashBP, FlashDL, JFlash, GDB
Checking target voltage...
Target voltage: 1.82 V
Listening on TCP/IP port 2331
Connecting to target...
J-Link found 1 JTAG device, Total IRLen = 4
JTAG ID: 0x5BA00477 \(Cortex-M7\)
Connected to target
Waiting for GDB connection...
Change to the directory that contains the example application output. The output can be found in using one of these paths, depending on the build target selected:
<install_dir>/boards/<board_name>/<example_type>/<application_name>/armgcc/debug<install_dir>/boards/<board_name>/<example_type>/<application_name>/armgcc/releaseFor this example, the path is:
*<install\_dir\>/boards/evkmimx8mn/demo\_apps/hello\_world/armgcc/debug*Start the GDB client:
$ arm-none-eabi-gdb hello_world.elf
GNU gdb (GNU Tools for Arm Embedded Processors 8-2018-q4-major) 8.2.50.20181213-git
Copyright (C) 2018 Free Software Foundation, Inc.
License GPLv3+: GNU GPL version 3 or later <http://gnu.org/licenses/gpl.html>
This is free software: you are free to change and redistribute it.
There is NO WARRANTY, to the extent permitted by law. Type "show copying"
and "show warranty" for details.
This GDB was configured as "--host=i686-w64-mingw32 --target=arm-none-eabi".
Type "show configuration" for configuration details.
For bug reporting instructions, please see:
<http://www.gnu.org/software/gdb/bugs/>.
Find the GDB manual and other documentation resources online at:
<http://www.gnu.org/software/gdb/documentation/>.
For help, type "help".
Type "apropos word" to search for commands related to "word"...
Reading symbols from hello_world.elf...
(gdb)
Connect to the GDB server and load the binary by running the following commands:
target remote localhost:2331monitor resetmonitor haltload
(gdb) target remote localhost:2331
Remote debugging using localhost:2331
0x00000008 in \_\_isr\_vector \(\)
(gdb) monitor reset
Resetting target
(gdb) monitor halt
(gdb) load
Loading section .interrupts, size 0x240 lma 0x0
Loading section .text, size 0x3ab8 lma 0x240
Loading section .ARM, size size 0x8 lma 0x3cf8
Loading section .init\_array, size 0x4 lma 0x3d00
Loading section .fini\_array, size 0x4 lma 0x3d04
Loading section .data, size 0x64 lma 0x3d08
Start address 0x2f4, load size 15724
Transfer rate: 264 KB/sec, 2620 bytes/write.
\(gdb\)
The application is now downloaded and halted at the reset vector. Execute the monitor go command to start the demo application.
(gdb) monitor go
The hello_world application is now running and a banner is displayed on the terminal. If this is not true, check your terminal settings and connections.
|
|
Parent topic:Linux OS host
Parent topic:Run a demo using Arm GCC
Windows OS host
The following sections provide steps to run a demo compiled with Arm GCC on Windows OS host.
Set up toolchain
This section contains the steps to install the necessary components required to build and run a MCUXpresso SDK demo application with the Arm GCC toolchain on Windows OS, as supported by the MCUXpresso SDK.
Install GCC Arm Embedded tool chain
Download and run the installer from GNU Arm Embedded Toolchain. This is the actual toolset (in other words, compiler, linker, and so on). The GCC toolchain should correspond to the latest supported version, as described in MCUXpresso SDK Release Notes.
Note: See Host setup for Windows OS before compiling the application.
Parent topic:Set up toolchain
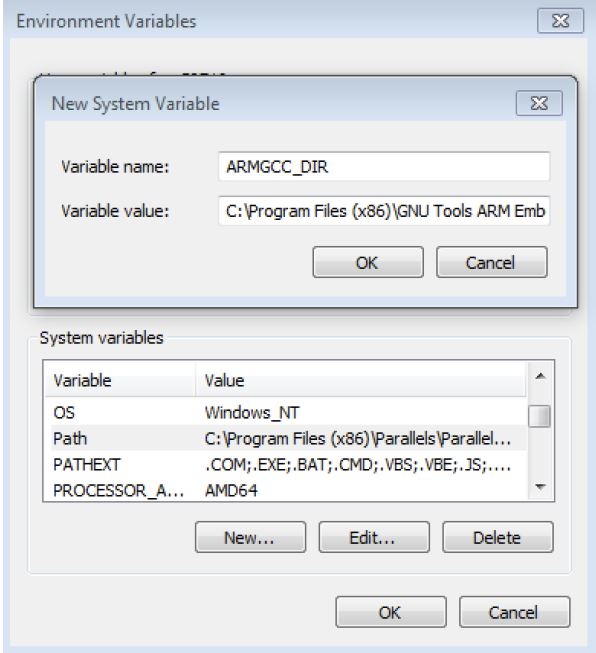
Add a new system environment variable for ARMGCC_DIR
Create a new system environment variable and name it ARMGCC_DIR. The value of this variable should point to the Arm GCC Embedded tool chain installation path.
C:\Program Files (x86)\GNU Tools Arm Embedded\8-2018-q4-major
Reference the installation folder of the GNU Arm GCC Embedded tools for the exact path name.
|
|
Parent topic:Set up toolchain
Parent topic:Windows OS host
Build an example application
To build an example application, follow these steps.
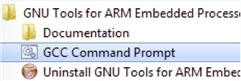
Open a GCC Arm Embedded tool chain command window. To launch the window, from the Windows operating system Start menu, go to Programs -> GNU Tools Arm Embedded <version> and select GCC Command Prompt.
|
|
Change the directory to the example application project directory, which has a path similar to the following:
<install_dir>/boards/<board_name>/<example_type>/<application_name>/armgcc
For this example, the exact path is:
<install_dir>/boards/evkmimx8mn/demo_apps/hello_world/armgcc
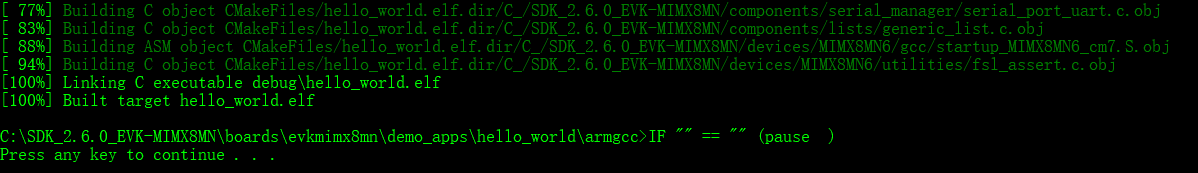
Type build_debug.bat on the command line or double click on the
build_debug.batfile in Windows Explorer to perform the build. The output is as shown in Figure 2.|
|
Parent topic:Windows OS host
Run an example application
This section describes steps to run a demo application using J-Link GDB Server application. To perform this exercise, the following step must be done:
You have a standalone J-Link pod that is connected to the debug interface of your board.
After the J-Link interface is configured and connected, follow these steps to download and run the demo applications:
Connect the development platform to your PC via USB cable between the USB-UART connector and the PC USB connector. If using a standalone J-Link debug pod, also connect it to the SWD/JTAG connector of the board.
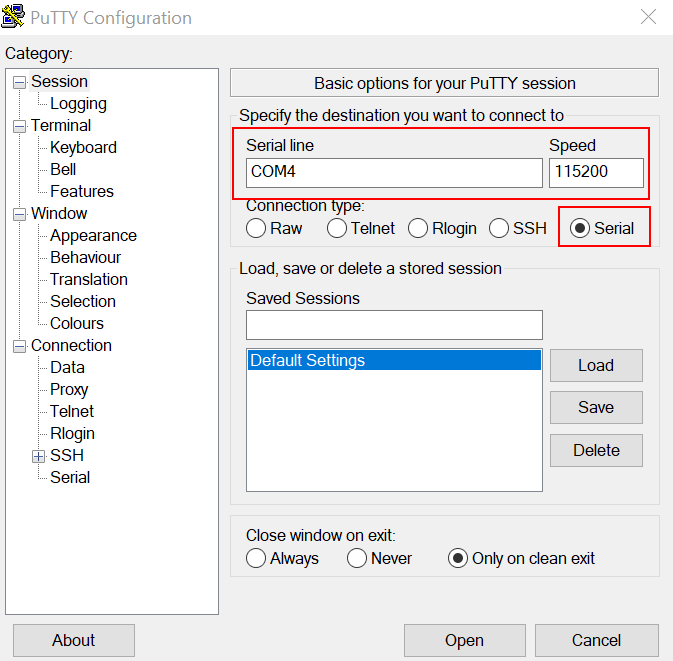
Open the terminal application on the PC, such as PuTTY or TeraTerm, and connect to the debug serial port number (to determine the COM port number, see How to determine COM port). Configure the terminal with these settings:
115200 baud rate
No parity
8 data bits
1 stop bit
|
|
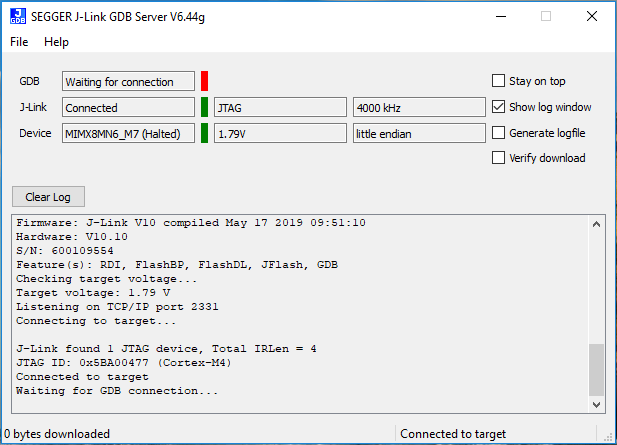
After GDB server is running, the screen should resemble Figure 2:
|
|
If not already running, open a GCC Arm Embedded tool chain command window. To launch the window, from the Windows operating system Start menu, go to Programs -> GNU Tools Arm Embedded <version> and select GCC Command Prompt.
|
|
Change to the directory that contains the example application output. The output can be found in using one of these paths, depending on the build target selected:
<install_dir>/boards/<board_name>/<example_type>/<application_name>/armgcc/debug
<install_dir>/boards/<board_name>/<example_type>/<application_name>/armgcc/release
For this example, the path is:
<install_dir>/boards/evkmimx8mn/demo_apps/hello_world/armgcc/debug
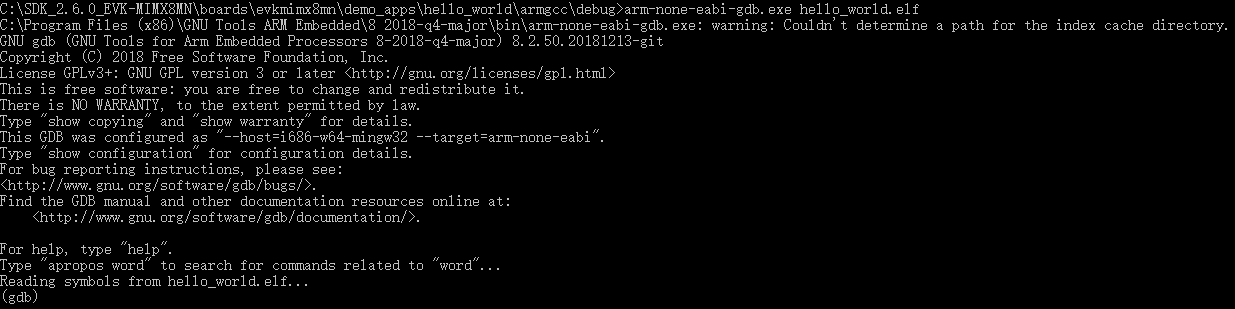
Run the command of
arm-none-eabi-gdb.exe <application_name>.elf. For this example, it isarm-none-eabi-gdb.exe hello_world.elf.|
|
Run these commands:
target remote localhost:2331monitor resetmonitor haltload
The application is now downloaded and halted at the reset vector. Execute the
monitor gocommand to start the demo application.
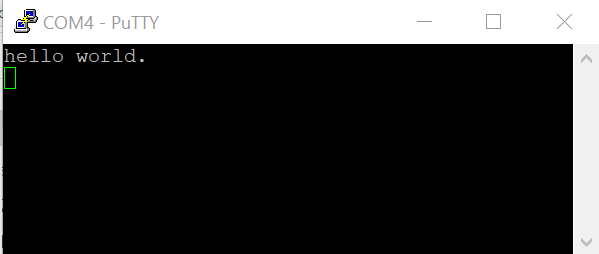
The hello_world application is now running and a banner is displayed on the terminal. If this is not true, check your terminal settings and connections.
|
|
Parent topic:Windows OS host
Parent topic:Run a demo using Arm GCC