Windows OS host
The following sections provide steps to run a demo compiled with Arm GCC on Windows OS host.
Set up toolchain
This section contains the steps to install the necessary components required to build and run a MCUXpresso SDK demo application with the Arm GCC toolchain on Windows OS, as supported by the MCUXpresso SDK.
Install GCC Arm Embedded tool chain
Download and run the installer from GNU Arm Embedded Toolchain. This is the actual toolset (in other words, compiler, linker, and so on). The GCC toolchain should correspond to the latest supported version, as described in MCUXpresso SDK Release Notes.
Note: See Host setup for Windows OS before compiling the application.
Parent topic:Set up toolchain
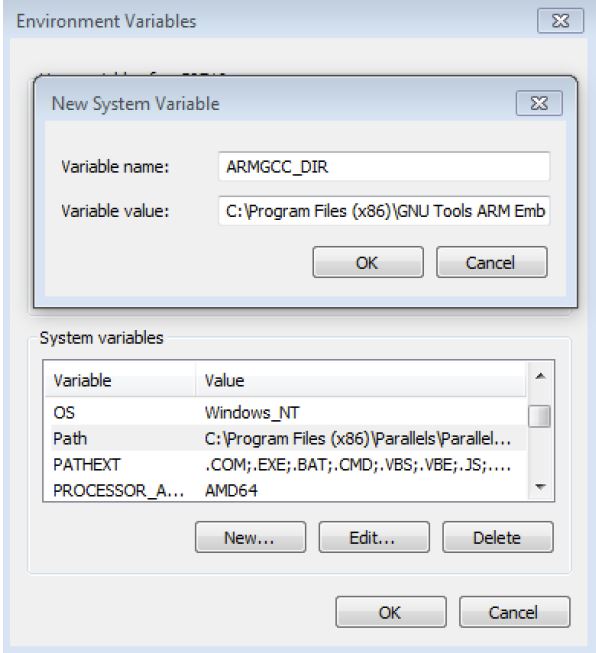
Add a new system environment variable for ARMGCC_DIR
Create a new system environment variable and name it ARMGCC_DIR. The value of this variable should point to the Arm GCC Embedded tool chain installation path.
C:\Program Files (x86)\GNU Tools Arm Embedded\9 2019-q4-major
Reference the installation folder of the GNU Arm GCC Embedded tools for the exact path name.
|
|
Parent topic:Set up toolchain
Parent topic:Windows OS host
Build an example application
To build an example application, follow these steps.
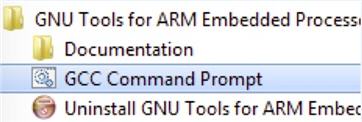
Open a GCC Arm Embedded tool chain command window. To launch the window, from the Windows operating system Start menu, go to Programs -> GNU Tools Arm Embedded <version> and select GCC Command Prompt.
|
|
Change the directory to the example application project directory, which has a path similar to the following:
<install_dir>/boards/<board_name>/<example_type>/<application_name>/armgcc
For this example, the exact path is:
<install_dir>/boards/mcimx93evk/demo_apps/hello_world/armgcc
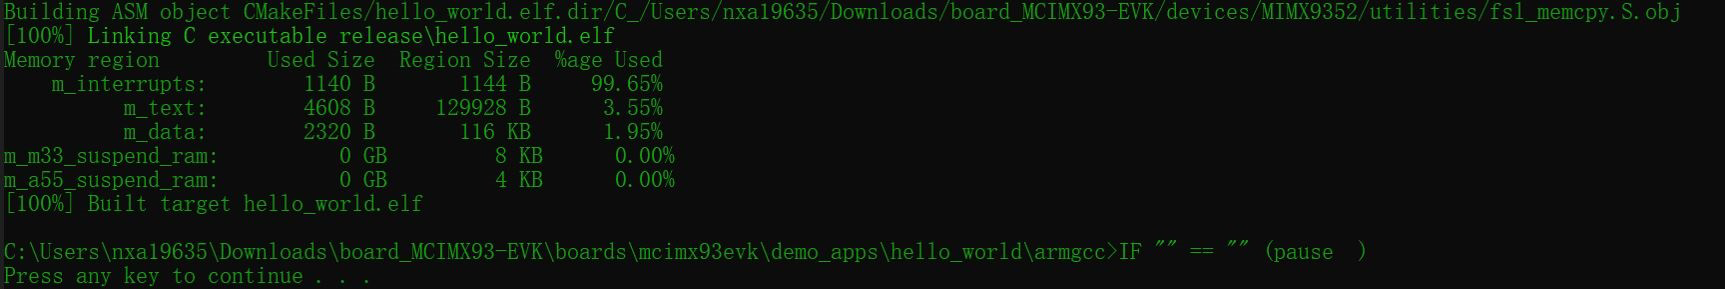
Type build_debug.bat on the command line or double click on the
build_debug.batfile in Windows Explorer to perform the build. The output is as shown in Figure 2.|
|
Parent topic:Windows OS host
Run an example application
This section describes steps to run a demo application using J-Link GDB Server application.
To perform this exercise, the following step must be done.
Connect the development platform to your PC via USB cable between the DBG USB connector (J1401) and the PC USB connector.
Connect 12 V ~ 20 V power supply and J-Link Plus to the device.
Switch SW1301[3:0] to the M core boot and ensure that the image is not available on the boot source. For example, 0b1010 for MicroSD boot. Keep the SD slot empty.
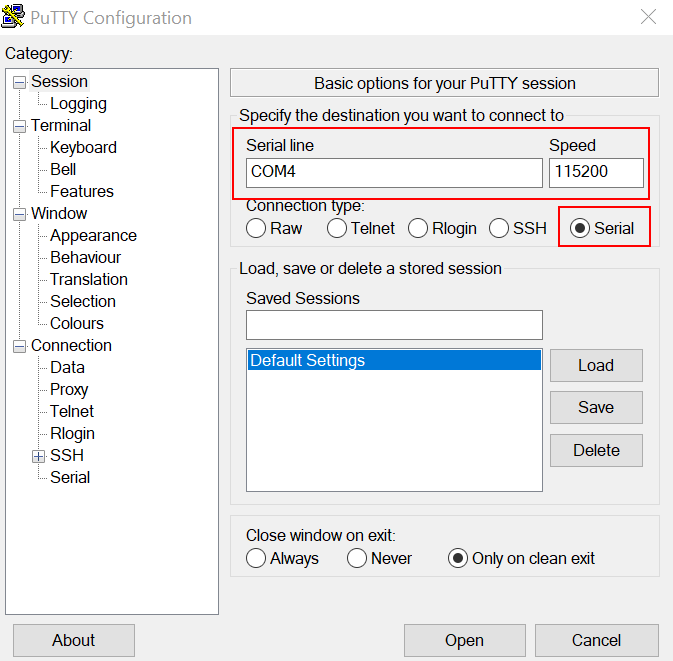
Open the terminal application on the PC, such as PuTTY or TeraTerm, connect to the debug COM port, see How to determine COM port, and configure the terminal with these settings:
115200 baud rate
No parity
8 data bits
1 stop bit
|
|
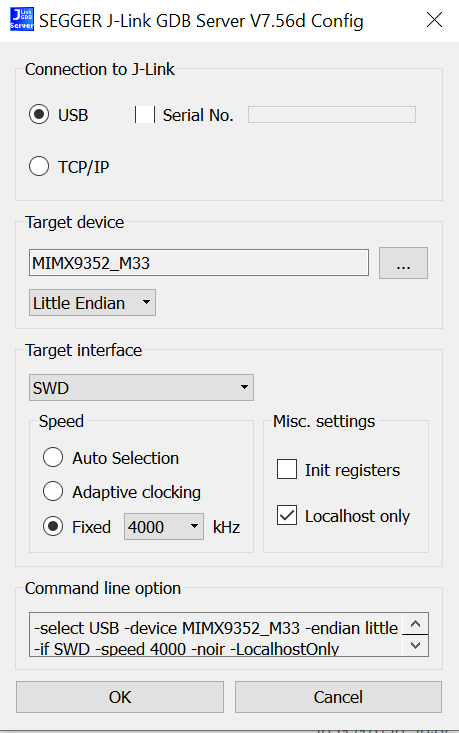
Open the J-Link GDB Server application. Assuming the J-Link software is installed, the application can be launched by going to the Windows operating system Start menu and selecting Programs -> SEGGER -> J-Link <version> J-Link GDB Server.
Modify the settings as shown in Figure 2. The target device selection chosen for this example is MIMX9352_M33 .
|
|
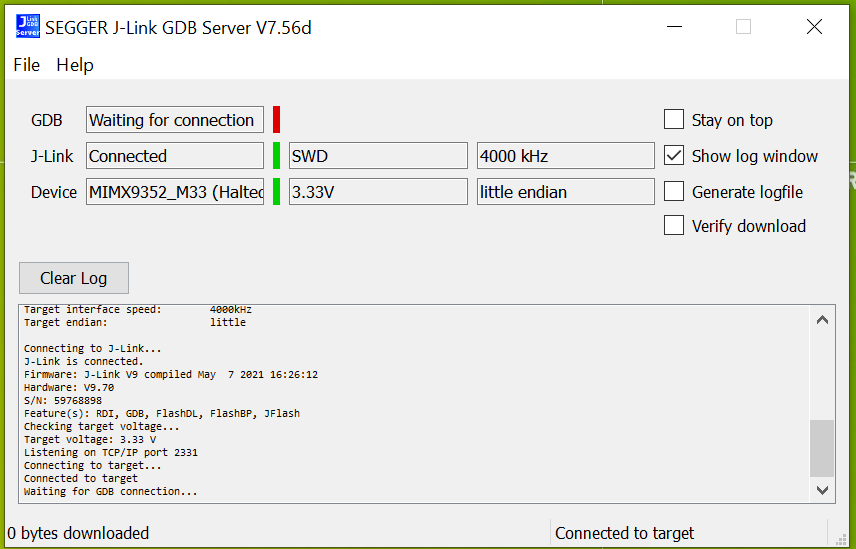
After GDB server is running, the screen should resemble Figure 3:
|
|
If not already running, open a GCC Arm Embedded tool chain command window. To launch the window, from the Windows operating system Start menu, go to Programs -> GNU Tools Arm Embedded <version> and select GCC Command Prompt.
|
|
Change to the directory that contains the example application output. The output can be found in using one of these paths, depending on the build target selected:
<install_dir>/boards/<board_name>/<example_type>/<application_name>/armgcc/debug
<install_dir>/boards/<board_name>/<example_type>/<application_name>/armgcc/release
For this example, the path is:
<install_dir>/boards/mcimx93evk/demo_apps/hello_world/armgcc/debug
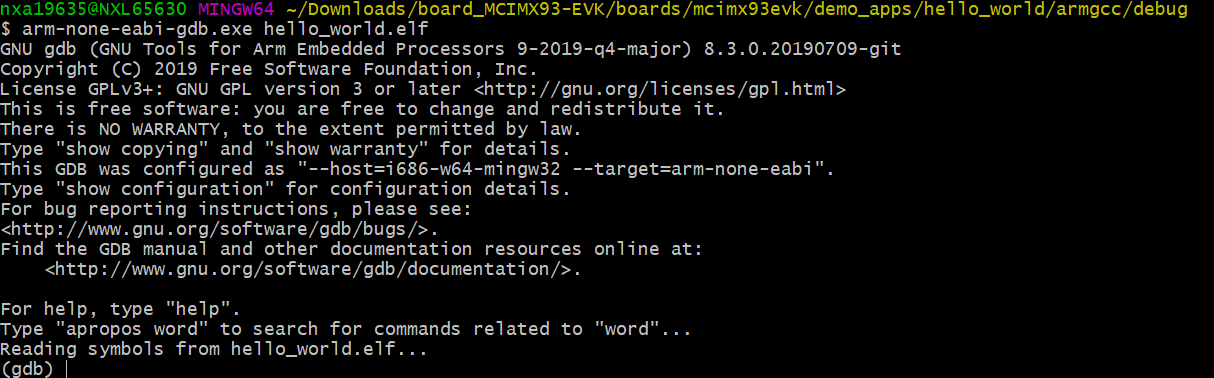
Run the command of
arm-none-eabi-gdb.exe <application_name>.elf. For this example, it isarm-none-eabi-gdb.exe hello_world.elf.|
|
Run these commands:
target remote localhost:2331monitor resetmonitor haltload
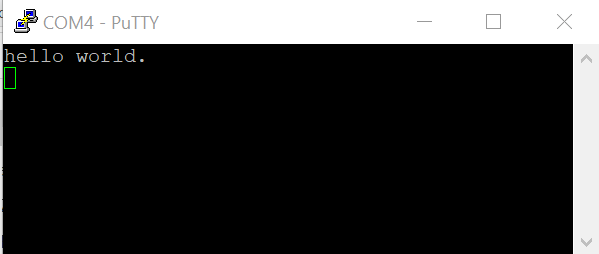
The application is now downloaded and halted at the reset vector. Execute the
monitor gocommand to start the demo application.
The hello_world application is now running and a banner is displayed on the terminal. If this is not true, check your terminal settings and connections.
|
|
Note: If the software is already running on the M core, the debugger loading image into TCM may get HardFault or a data verification issue. NXP recommends you to follow the steps above to use the debugger. Repowering the board is required to restart the debugger.
Parent topic:Windows OS host
Parent topic:Run a demo using Arm GCC