Run a demo using MCUXpresso for VS Code
This section explains how to configure MCUXpresso for VS Code to build, run, and debug example applications. This guide uses the hello_world demo application as an example. However, these steps can be applied to any example application in the MCUXpresso SDK.
Build an example application
This section assumes that the user has already obtained the SDK as outlined in Get MCUXpresso SDK Repo.
To build an example application:
Import the SDK into your workspace. Click Import Repository from the QUICKSTART PANEL.
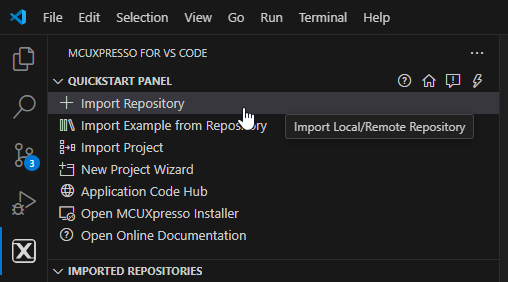
Note: You can import the SDK in several ways. Refer to MCUXpresso for VS Code Wiki for details.
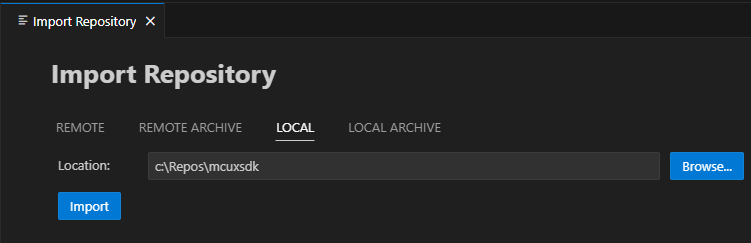
Select Local if you’ve already obtained the SDK as seen in Get MCUXpresso SDK Repo. Select your location and click Import.
Click Import Example from Repository from the QUICKSTART PANEL.
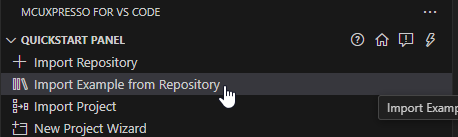
In the dropdown menu, select the MCUXpresso SDK, the Arm GNU Toolchain, your board, template, and application type. Click Import.
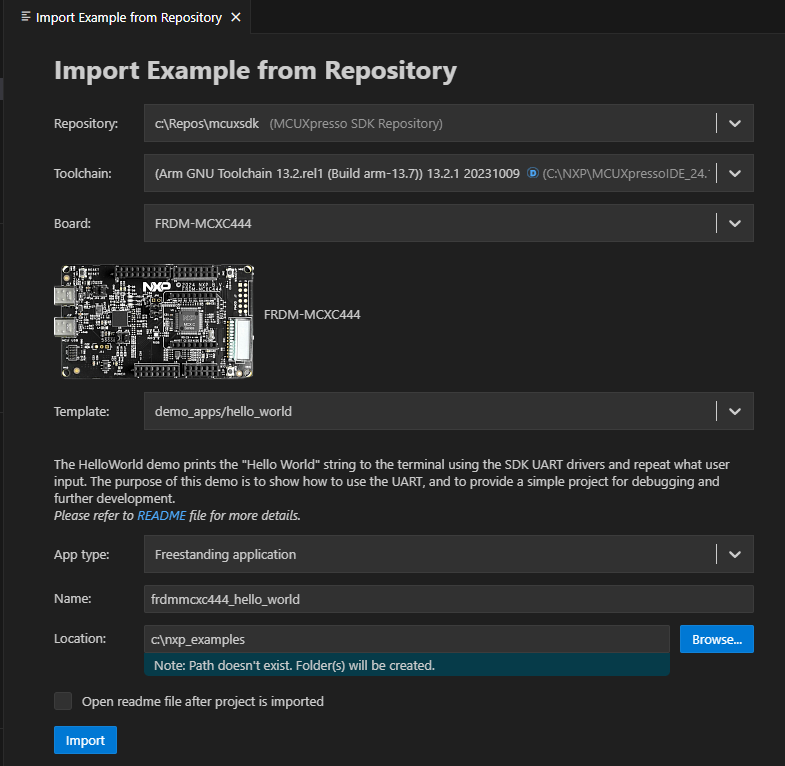
Note: The MCUXpresso SDK projects can be imported as Repository applications or Freestanding applications. The difference between the two is the import location. Projects imported as Repository examples will be located inside the MCUXpresso SDK, whereas Freestanding examples can be imported to a user-defined location. Select between these by designating your selection in the App type dropdown menu.
VS Code will prompt you to confirm if the imported files are trusted. Click Yes.
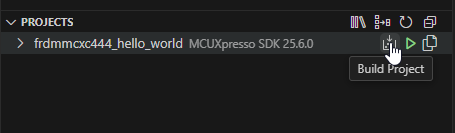
Navigate to the PROJECTS view. Find your project and click the Build Project icon.
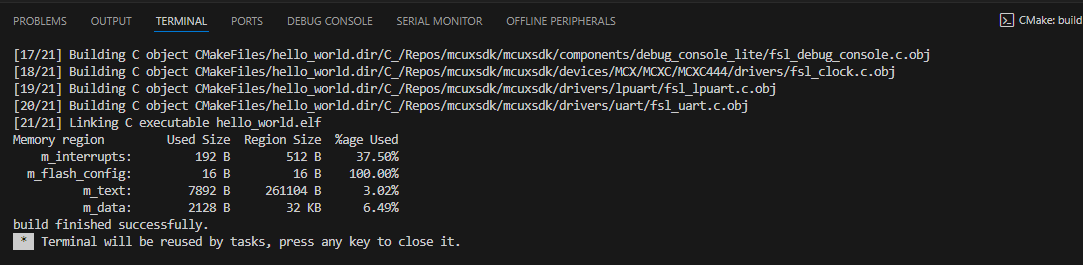
The integrated terminal will open at the bottom and will display the build output.
Run an example application
Note: for full details on MCUXpresso for VS Code debug probe support, see MCUXpresso for VS Code Wiki.
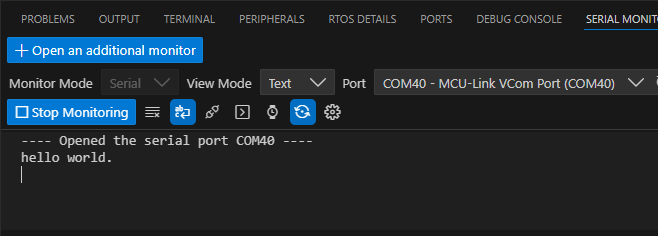
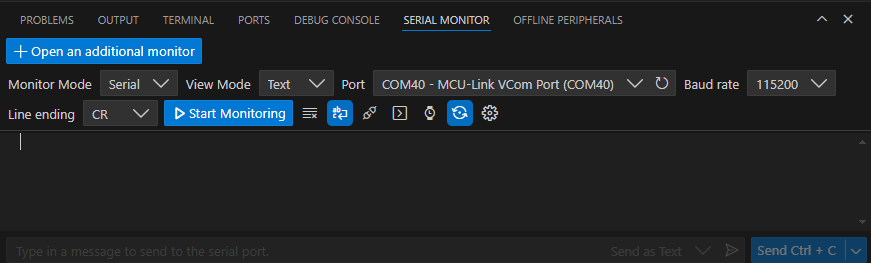
Open the Serial Monitor from the VS Code’s integrated terminal. Select the VCom Port for your device and set the baud rate to 115200.
Navigate to the PROJECTS view and click the play button to initiate a debug session.
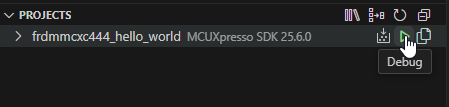
The debug session will begin. The debug controls are initially at the top.
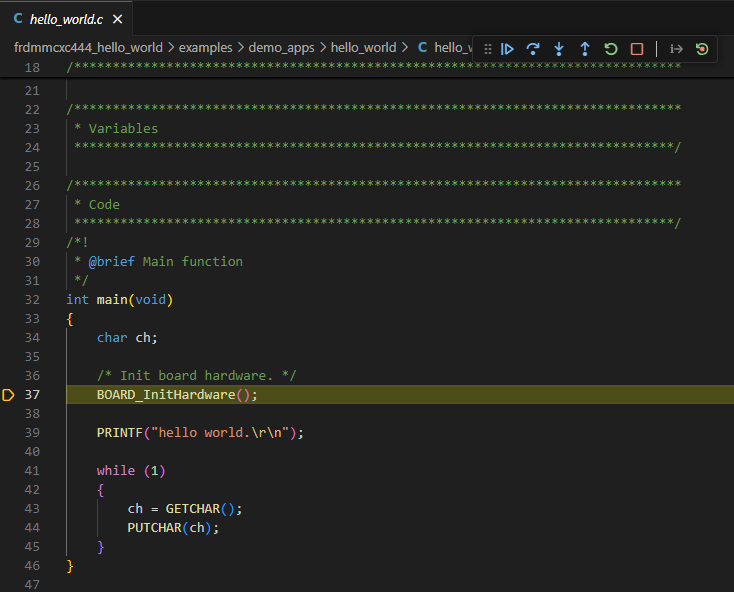 .
.Click Continue on the debug controls to resume execution of the code. Observe the output on the Serial Monitor.