Run and Debug DSP Demo using Xplorer IDE
This section lists the steps to:
Prepare Arm Core for ‘Hello World’
Each of the DSP demos included in the MCUXpresso SDK consists of two separate applications that run on the Arm core and DSP core. The Arm core application initializes the DSP core in the manner described in Initialize DSP Core and executes other application-specific functionality.
To debug the ‘Hello World’ DSP application, you must first set up and execute the Arm application using an environment of your choice.
Build and execute the ‘Hello World’ Arm demo located in:
<SDK_ROOT>/boards/evkmimxrt685/dsp_examples/hello_world_usart/cm33/.
Preparing an Arm core development environment is outside the scope of this document. For information on how to use the SDK for Arm core development, see the Getting Started with MCUXpresso SDK for MIMXRT600.pdf document at <SDK_ROOT>/docs/.
Note: IAR Embedded Workbench may require a patch to enable compatibility with RT600. For details on the patch, contact NXP directly.
Note: If you are using MCUXpresso, it is highly recommended to upgrade to latest version of the SDK and match the latest EVK board.
Parent topic:Run and Debug DSP Demo using Xplorer IDE
Start Xtensa Debugger Daemon
To debug DSP applications on RT600, ensure that the xt-ocd daemon is running. This application runs a gdb server that the Xtensa core debugger connects to.
Go to the command-line window and change directory (cd) to xt-ocd daemon installation path. The default path on Windows is C:\Program Files (x86)\Tensilica\Xtensa OCD Daemon 14.08.
Execute the daemon with the custom topology.
**xt-ocd.exe -c topology.xml**
XOCD <VERSION_INFO>
(c) 1999-2021 Cadence Design Systems Inc. All rights reserved.
[Debug Log 2021-06-17 08:12:29]
Loading module "gdbstub" <VERSION_INFO>
Loading module "jlink" <VERSION_INFO>
Using JLINK lib <VERSION_INFO>
Jlink USB Serial Number: XXXXXXXXX
Connected to Jlink Device:
  Name:'J-Link LPCXpresso V2 compiled Apr  4 2019 16:54:03'
  S/N:XXXXXXXX
  Firmware: J-Link LPCXpresso V2 compiled Apr  4 2019 16:54:03
  Requested/Set TCK: 2000kHz/65534kHz
Jlink: Select SWD
SWD-DP with ID 0x6BA02477
Loading module "jtag" <VERSION_INFO>
Loading module "xtensa" <VERSION_INFO>
Starting thread 'GDBStub'
Opened GDB socket at port 20000
Initialize XDM driver
Warning: Warning: DAP Reset request failed! Ignoring...
Note: Some warning messages are expected and can be ignored. If you receive an error initializing the XDM driver, initialize and start the DSP core before debugging. For details on initializing and debugging, see Initialize DSP Core and Link DSP Profiles. For details on xt-ocd runtime options and configuration, see Chapter 7 of the Xtensa Debug Guide, available in Help > PDF Documentation.
Parent topic:Run and Debug DSP Demo using Xplorer IDE
Prepare DSP Core for ‘Hello World’
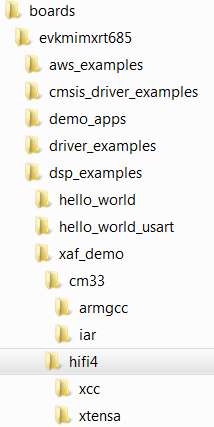
The RT600 SDK provides a collection of DSP example applications located in boards/evkmimxrt685/dsp_examples/. Each DSP example has two source directories, one for the Arm Cortex-M33 core (‘cm33’) and one for the DSP HiFi4 core (‘dsp’).
|
|
The projects for different supported toolchains are build in the above directories. For the DSP example above, the ‘xcc’ project builds on the command line and the ‘xtensa’ directory is an Xplorer IDE project.
To run the ‘Hello World’ demo, import the SDK sources into the Xplorer IDE.
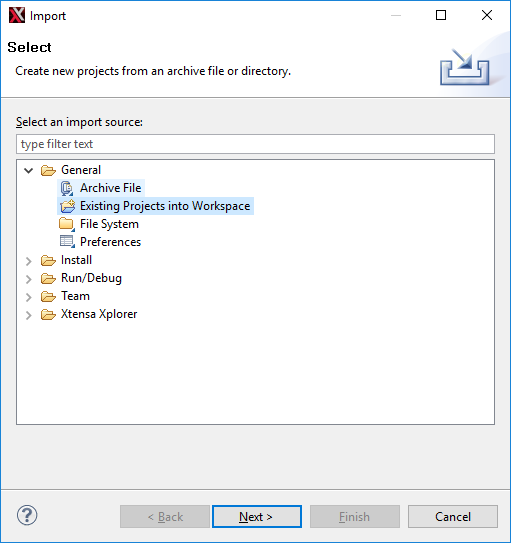
Select File > Import > General > Existing Projects into Workspace.
|
|
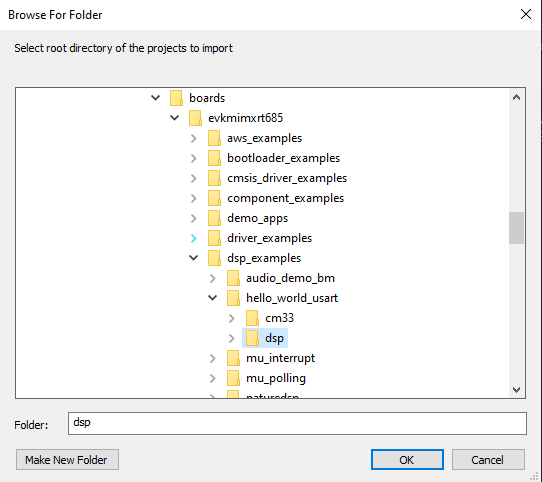
Select the SDK directory
<SDK_ROOT>\boards\evkmimxrt685\dsp_examples\hello_world_usart\dsp\xtensaas root directory.|
|
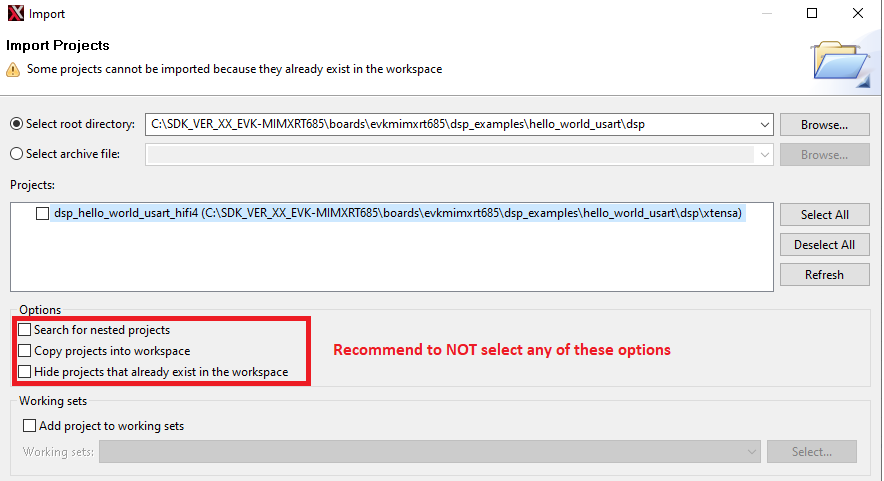
Leave all the other check boxes blank.
|
|
Once imported, the ‘dsp\_hello\_world\_usart\_hifi4’ appears in the Project Explorer.
To make a build selection for the project and hardware target configuration, use the drop-down buttons on the menu bar.
|
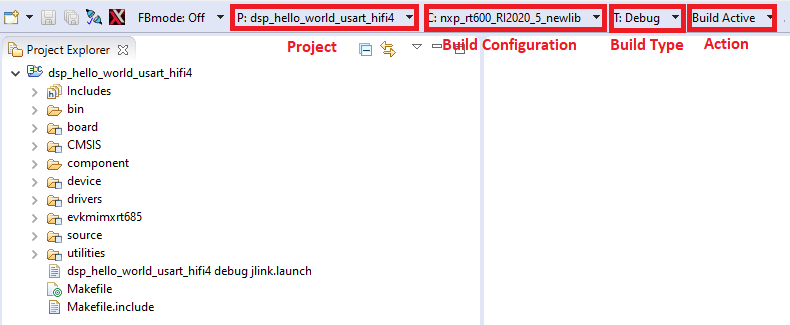
|
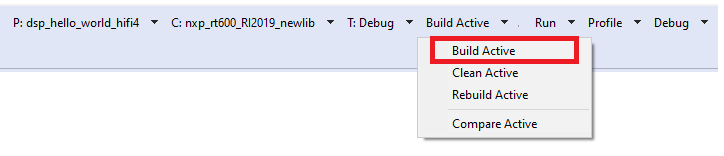
To build the project for debug, profile, or trace, use the action buttons on the right side of the menu bar.
|
|
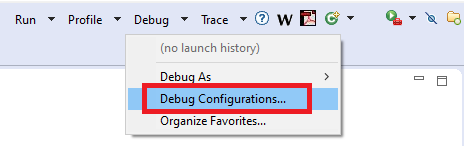
A default debug configuration is provided by the SDK project, which utilizes the on-chip debugger.
To choose the configuration, select the Debug Configurations menu item.
|
|
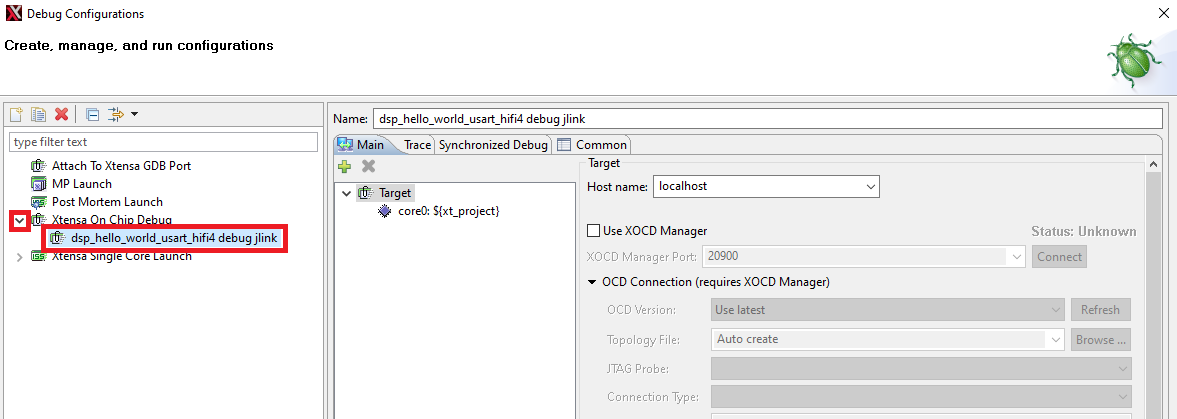
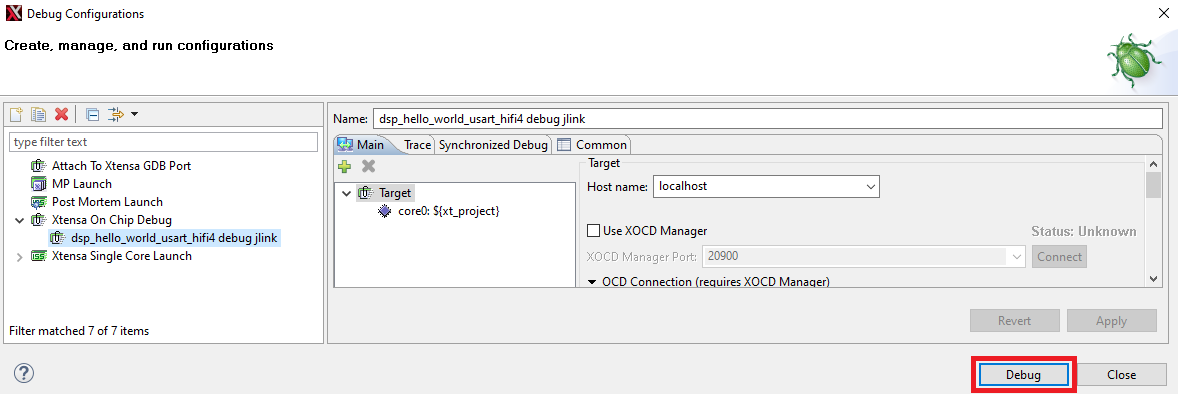
The **Debug Configurations** dialog box appears.
Expand the Xtensa On Chip Debug tree option and select ‘dsp_hello_world_hifi4_debug_jlink’.
|
|
Click the Debug button. The actual debug on the chip initiates.
|
|
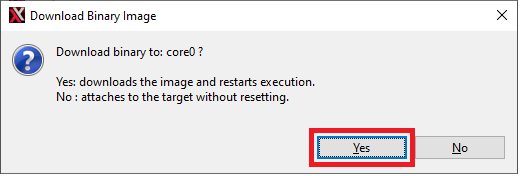
The Xplorer IDE prompts whether binaries should download to the hardware.
Select Yes.
|
|
The Xplorer IDE transitions to the Debug perspective after the binary download.
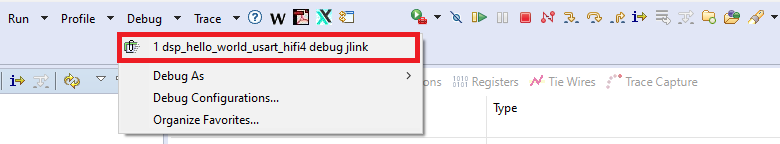
Note: After initial configuration, it is possible to select the same debug configuration as in Figure 8.
|
|
The **Debug** perspective appears as in [Figure 9](prepare_dsp_core_for_hello_world.md#GVDVWQC).
|
|
The program stops at the start of main\(\) function. To run the program, click the **Resume** or **Stepping through** icon button as shown in [Figure 10](prepare_dsp_core_for_hello_world.md#LKWEUGG).
|
|
After resuming / stepping through the ‘printf’ statement, the following output appears in the Console view of the IDE.
Hello World running on core nxp_rt600_RI2020_5_newlib
To return to the default IDE layout after the debugging completes, select the previous code perspective.
|

|
Parent topic:Run and Debug DSP Demo using Xplorer IDE
Run and Debug DSP Audio Framework
The DSP audio framework demo consists of separate applications that run on the Arm core and DSP core. The Arm application runs a command shell and relays the input requests to the DSP application using RPMsg-Lite.
EVK Board Setup for Audio Demo
The DSP audio demo is tested against EVK-MIMXRT685 Rev E and requires UART for serial console.
For the codec to output audio properly, attach one jumper on the board as follows:
JP7-1 <==> JP8-2
Note: DSP operates DMA and audio peripherals same as CM33 side. Jumper settings, I2S configs, or pin mux settings are all same with CM33 side. For information on steps to operate I2S, DMIC and DMA, see the SDK CM33 side driver examples. SDK\boards\evkmimxrt685\driver_examples\i2s;
Note: Jumper settings are different on different version of EVKs or validation boards. The above mentioned setting is for SDK 2.8.0 and Rev E EVK or later only. For old version of boards or SDKs, double check the SDK driver examples for correct settings for the pin mux and jumper settings.
The demo uses the UART for console input and output. Connect the EVK board to a PC via the USB debug interface (J5) and open up a serial interface on your PC using a terminal tool such as PuTTY on Windows or screen on Linux.
Parent topic:Run and Debug DSP Audio Framework
Debug Audio Demo
To debug this DSP application, set up and execute the Arm application in a desired environment. For more information on Arm development environment options, see ‘Getting Started with MCUXpresso SDK for EVK-MIMXRT685.pdf.
The following example uses the NXP MCUXpresso IDE for the Arm environment.
To debug the audio demo, perform the following steps.
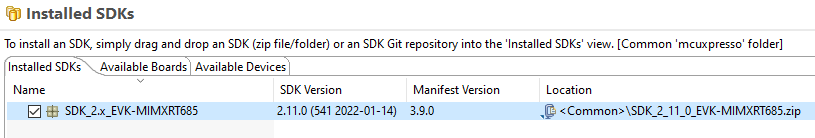
Install the MCUXpresso SDK for RT600 into the MCUXpresso IDE using the Installed SDK panel as shown in
|
|
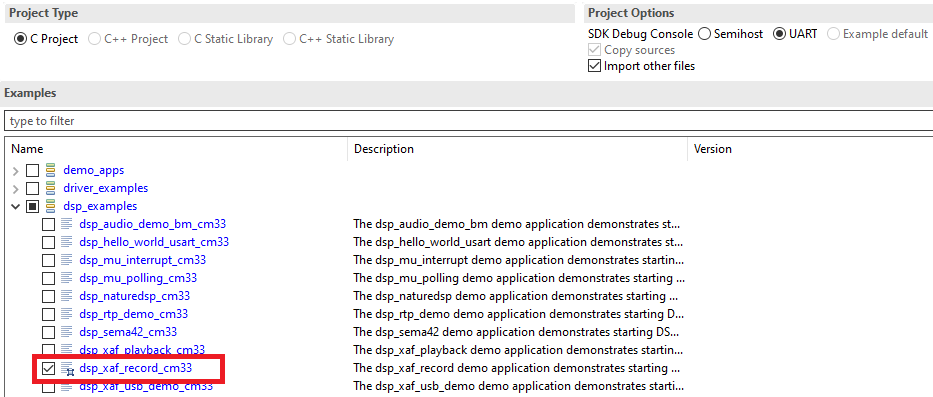
To import an example from the installed SDK., use the Import SDK examples link in the Quickstart panel on the lower left of the screen.
|

|
Select the ‘dsp_xaf_record_cm33’ example for Cortex-M33 core.
|
|
Click the Finish button.
|

|
Build the project and launch the debugger on success.
|

|
Use the debug toolbar to resume the code execution.
|

|
Observe serial terminal output with shell prompt.
******************************
DSP audio framework demo start
******************************
Configure WM8904 codec
DSP image copied to DSP TCM
[APP_DSP_IPC_Task] start
[APP_Shell_Task] start
Copyright  2022  NXP
>>
Using the Xplorer IDE, load and execute
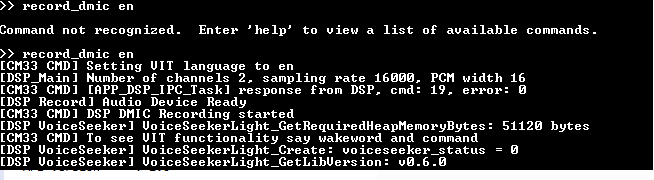
xaf_recordusing the steps described in Prepare DSP Core for ‘Hello World’.After the DSP application runs, use the serial shell to invoke the ‘
record_dmic [language]’ command.For information on the supported languages, check VIT ReleaseNotes.txt. Using the serial shell creates an audio pipeline that captures microphone audio, perform voice recognition (VIT), and playback via the codec speaker line out (J4 on the EVK).>> help "help": List all the registered commands "exit": Exit program "version": Query DSP for component versions "record_dmic": Record DMIC audio , perform voice recognition (VIT) and playback on codec USAGE: record_dmic [language]
For voice recognition say supported the wake-word and in 3 s say the frame supported command. If selected model contains strings, then the wake-word and the list of commands appears in the console.
Note: this command does not return to the shell
The serial terminal shows the IPC communications to set up an audio device..
|
|
The VIT wake-word and supported commands appear in the serial console.
|
|
The serial console prints the detected wake-word and commands.
|
|
For more information on configuration and using the Audio Framework demo, see the file `<SDK_ROOT>\boards\evkmimxrt685\dsp_examples\xaf_record\cm33\readme.txt.`.

For more details about VIT which supports English and Mandarin models, see `<SDK_ROOT>\middleware\vit\HIFI4\Doc\VIT_Integration_Guide.pdf`.
Parent topic:Run and Debug DSP Audio Framework
Parent topic:Run and Debug DSP Demo using Xplorer IDE
Launch DSP Application from Arm Core
In the previous example, the Arm application and DSP application are independently loaded and debugged. This section list the steps to produce one Arm application binary that includes and starts the DSP application without the use of a debugger or a loader.
The Arm core application for each DSP demo uses a global preprocessor macro to control loading of the DSP binary application:
DSP_IMAGE_COPY_TO_RAM
When this macro is set to ‘1’/TRUE (default value), it instructs the DSP demo application to do the following:
Link the DSP application binary images into the Arm binary
Copy the DSP application images into RAM on program boot
Initialize the DSP to run from the RAM image
Note: When modifying the Arm project, make sure to supply the global preprocessor macro to both the C compiler and assembler.
To build the DSP application image for the Arm application, select the Release target option in the Xplorer IDE. For more information on building with min-rt LSP, see section Link DSP Profiles.
|
|
Three DSP binaries are generated and are loaded into different TCM or SRAM address segments:
<SDK_ROOT>/boards/evkmimxrt685/dsp_examples/xaf_record/dsp/binary/**dsp\_data\_release.bin**<SDK_ROOT>/boards/evkmimxrt685/dsp_examples/xaf_record/dsp/binary/**dsp\_text\_release.bin**<SDK_ROOT>/boards/evkmimxrt685/dsp_examples/xaf_record/dsp/binary/**dsp\_ncache\_release.bin**Note: Depending on the environment, there might be a need to copy the binary images into the Arm application workspace.
Parent topic:Run and Debug DSP Demo using Xplorer IDE