Run and Debug DSP Demo using Xplorer IDE
Prepare Arm Core for ‘Hello World’
The DSP demos contained in the MCUXpresso SDK each consist of two separate applications that run on the Arm core and DSP core. The Arm core application initializes the DSP core in the manner described in section 2.3 and executes other application-specific functionality.
In order to debug the ‘Hello World’ DSP application, first set up and execute the Arm application using an environment of your choosing:
Build and execute the ‘Hello World’ Arm demo at:
<SDK_ROOT>/boards/evkmimxrt595/dsp_examples/hello_world_usart/cm33/
Preparing an Arm core development environment is outside the scope of this document. For information on using the SDK for Arm core development, refer to the document ‘Getting Started with MCUXpresso SDK for MIMXRT500.pdf’ located under <SDK_ROOT>/docs/.
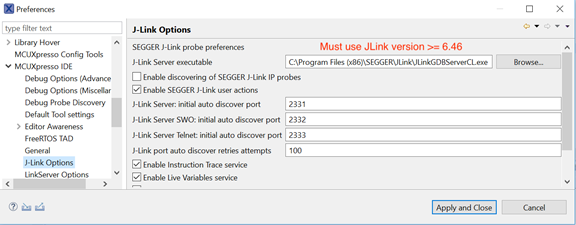
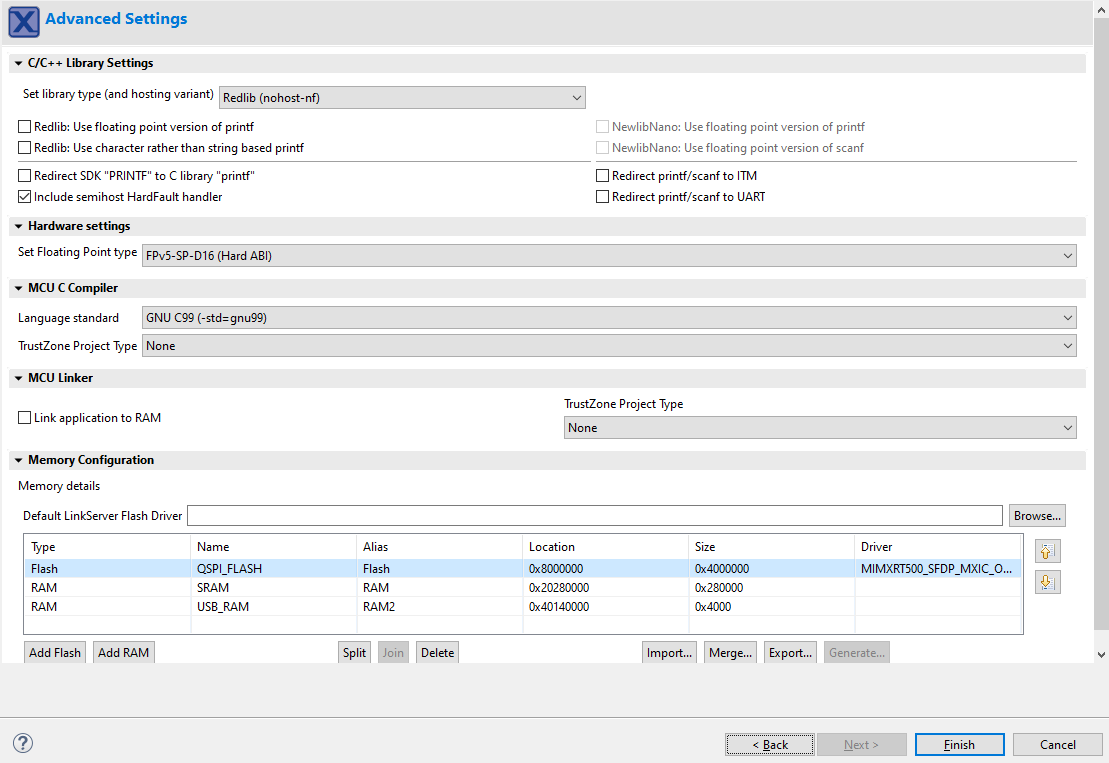
Note: SEGGER J-Link software version >= 6.46 is required for compatibility with RT500. MCUXpresso IDE may ship with an older version, which is customized as in Figure 1.
|
|
Parent topic:Run and Debug DSP Demo using Xplorer IDE
Prepare DSP Core for ‘Hello World’
The RT500 SDK provides a collection of DSP example applications located under boards/evkmimxrt595/dsp_examples/. Each DSP example has two source directories, one for the Arm Cortex-M33 core (‘cm33’) and one for the DSP fusion f1 core (‘fusionf1’):
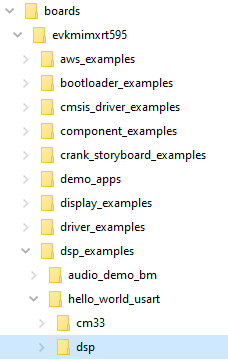
Under these directories are build projects for different supported toolchains. For the DSP example above, the ‘xcc’ project allows to build on the command line and the ‘xtensa’ directory is an Xplorer IDE project.
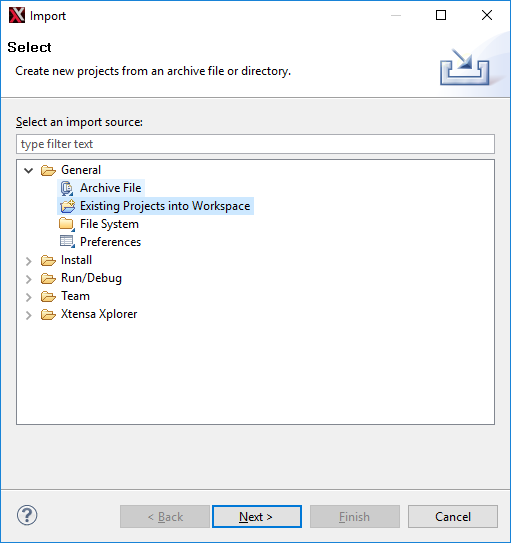
To run the ‘Hello World’ demo, first you must import SDK sources into Xplorer IDE.
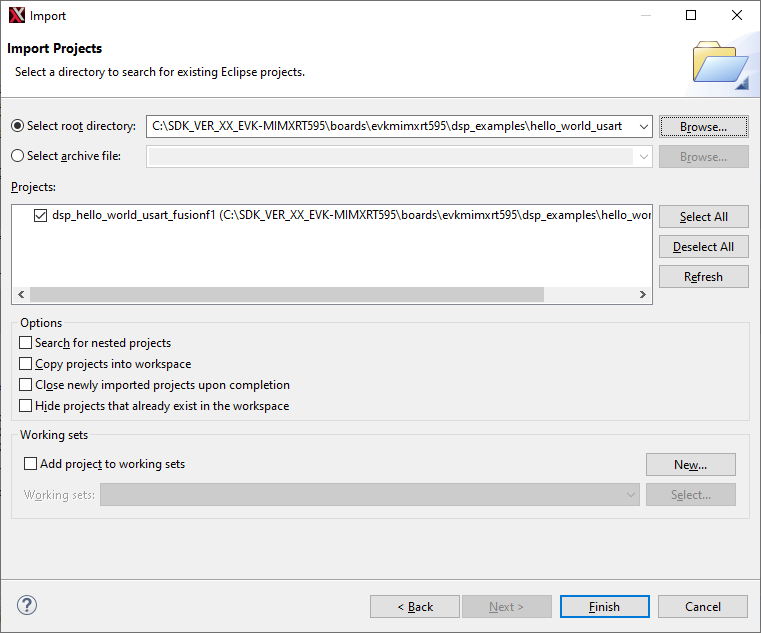
Use menu item File > Import > Existing Projects into Workspace.
|
|
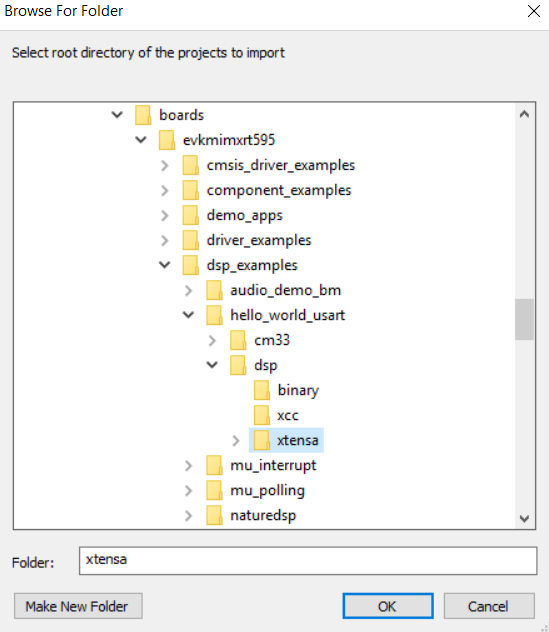
Select SDK directory
<SDK_ROOT>\boards\evkmimxrt595\dsp_examples\hello_world_usart \fusionf1\xtensaas root directory and leave all other check boxes blank as default.|
|
Click OK.
|
|
Click the Finish button.
The ‘dsp_hello_world_usart_fusionf1’ project appears in the Project Explorer.
.
Parent topic:Run and Debug DSP Demo using Xplorer IDE
DSP Linking Profiles
The Xtensa Software Tools use linker support packages (LSPs) to link a Fusion DSP application for the RT500. An LSP includes both a system memory map and a collection of libraries to include into the final binary. These LSPs are provided in the MCUXpresso SDK under <SDK_ROOT>/devices/MIMXRT595S/xtensa/.
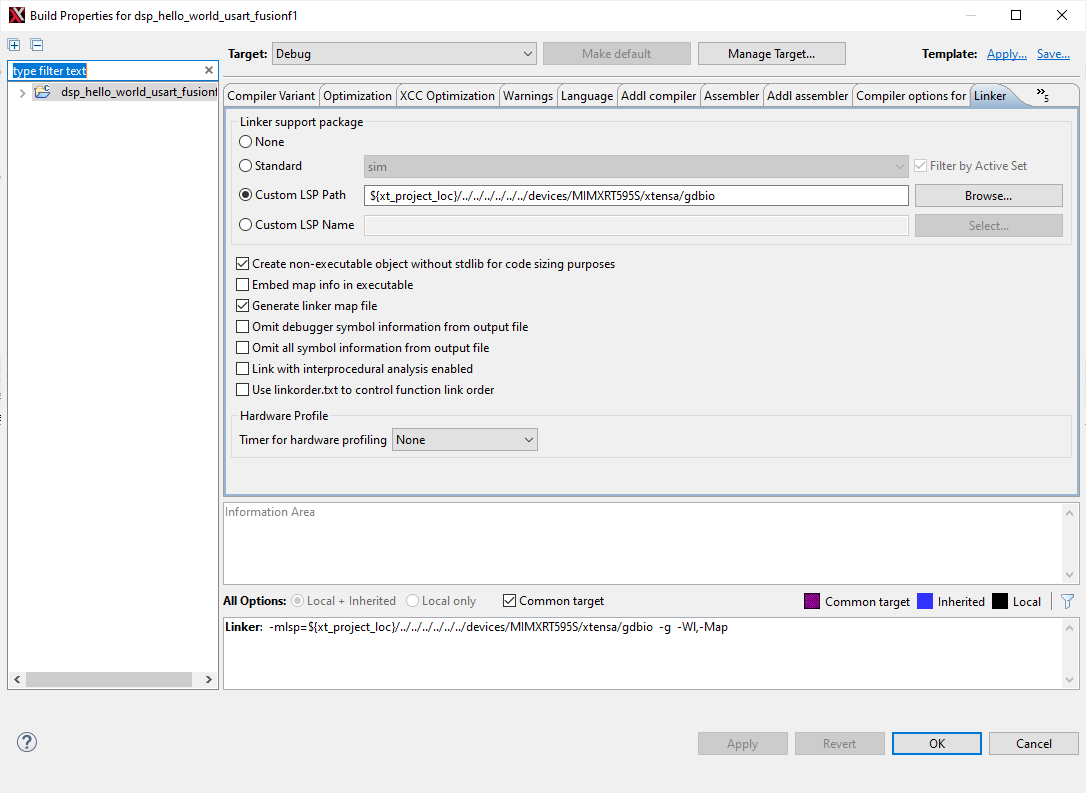
DSP sample applications are configured to link against one of these custom LSPs. By default, ‘Debug’ targets links against the gdbio LSP which is intended to be used with an attached debugger and captures I/O requests (printf) through gdb. The ‘Release’ target links against the min-rt LSP which includes minimal runtime support.
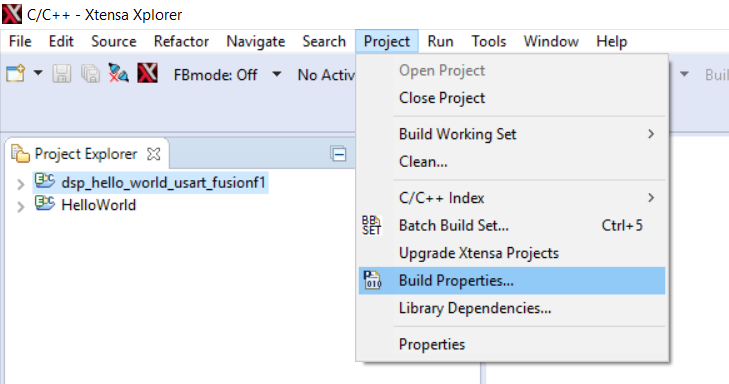
You can see and change which LSP is being actively used by the project target in the Xplorer IDE in the Linker menu of the project.
|
|
|
|
The MCUXpresso SDK ships with other standard LSPs for RT500. For more information on using LSPs and how to create a custom memory map using Xtensa software tools, see the Cadence Linker Support Packages (LSPs) Reference Manual.
Parent topic:Run and Debug DSP Demo using Xplorer IDE
Build the Xplorer project.
To make a build selection for the project and hardware target configuration, use the drop-down buttons on the menu bar.
|
|
Parent topic:Run and Debug DSP Demo using Xplorer IDE
Start Xtensa Debugger Daemon
Connect the EVK board to a PC via the USB debug interface (J40) and open up a serial interface on your PC using a terminal tool such as Tera term or PuTTY on Windows or screen on Linux.
Remove Jumpers JP17, JP18, JP19 for SWD to connect to the chip and Serial interface on J40.
Load CM33 hello_world_usart you build from step 3.1 using J-link
To debug DSP applications on RT500, you must have the xt-ocd daemon up running. This application runs a gdb server that the Xtensa core debugger connects with.
Go to the command-line window and cd to xt-ocd daemon installation path. By default, it is C:\Program Files (x86)\Tensilica\Xtensa OCD Daemon 14.11 on Windows.
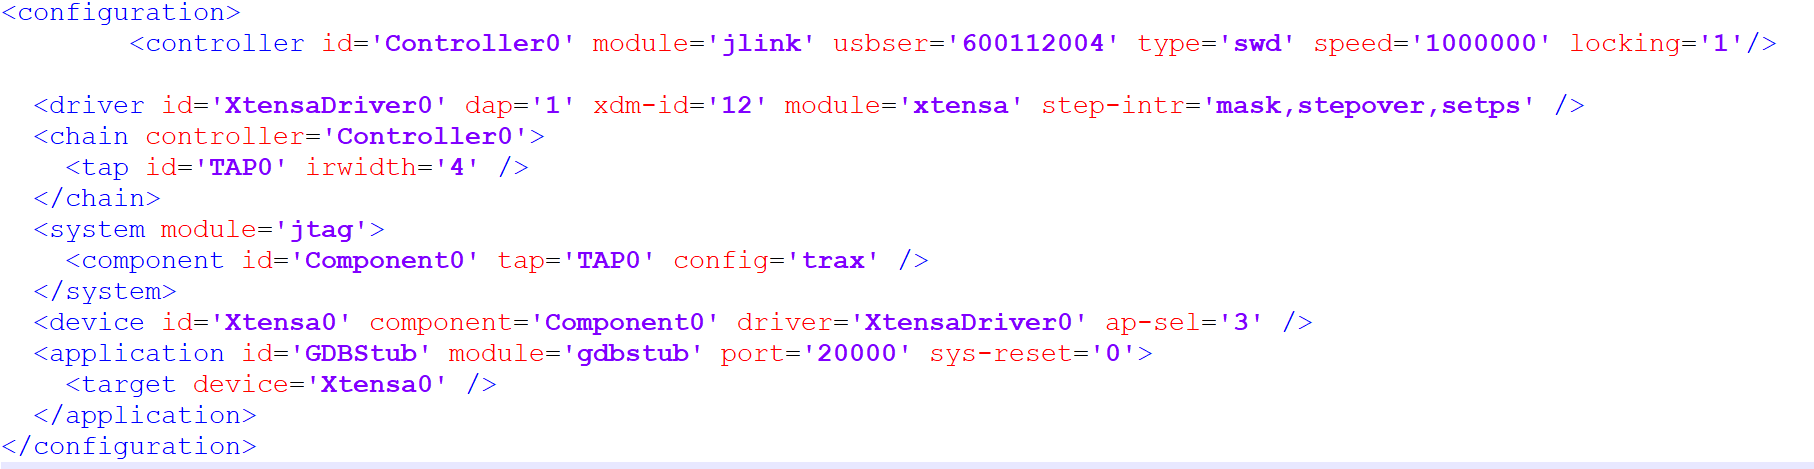
Update the topology.xml file with your J-link serial number. Topology.xml file: Edited J-link serial number in usbser field. Ensure dap = 1 in order for it to work.
Execute the daemon with your custom topology:
xt-ocd.exe -c topology.xml
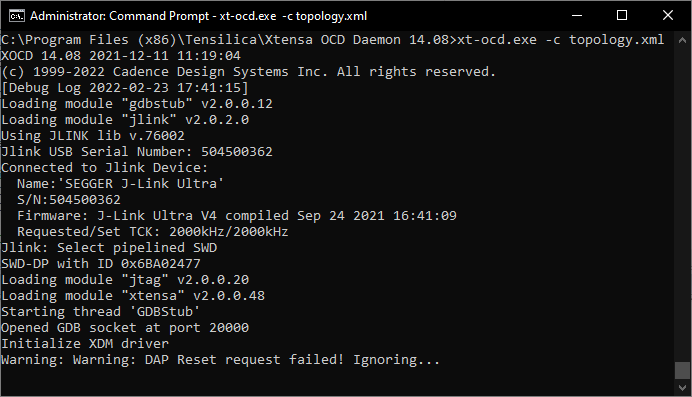
Note: tSome warning messages are expected and can be ignored. If you receive an error initializing the XDM driver, you may need to initialize and start he DSP core before debugging. For details, see DSP Core Initialization.
Note: For more information on xt-ocd runtime options and configuration, see Chapter 7 of the Xtensa Debug Guide (available in Help > PDF Documentation).
Use the action buttons on the right side of the menu bar to debug / profile / trace. A default debug configuration is provided by the SDK project which utilizes the on-chip debugger.
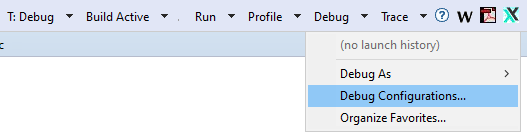
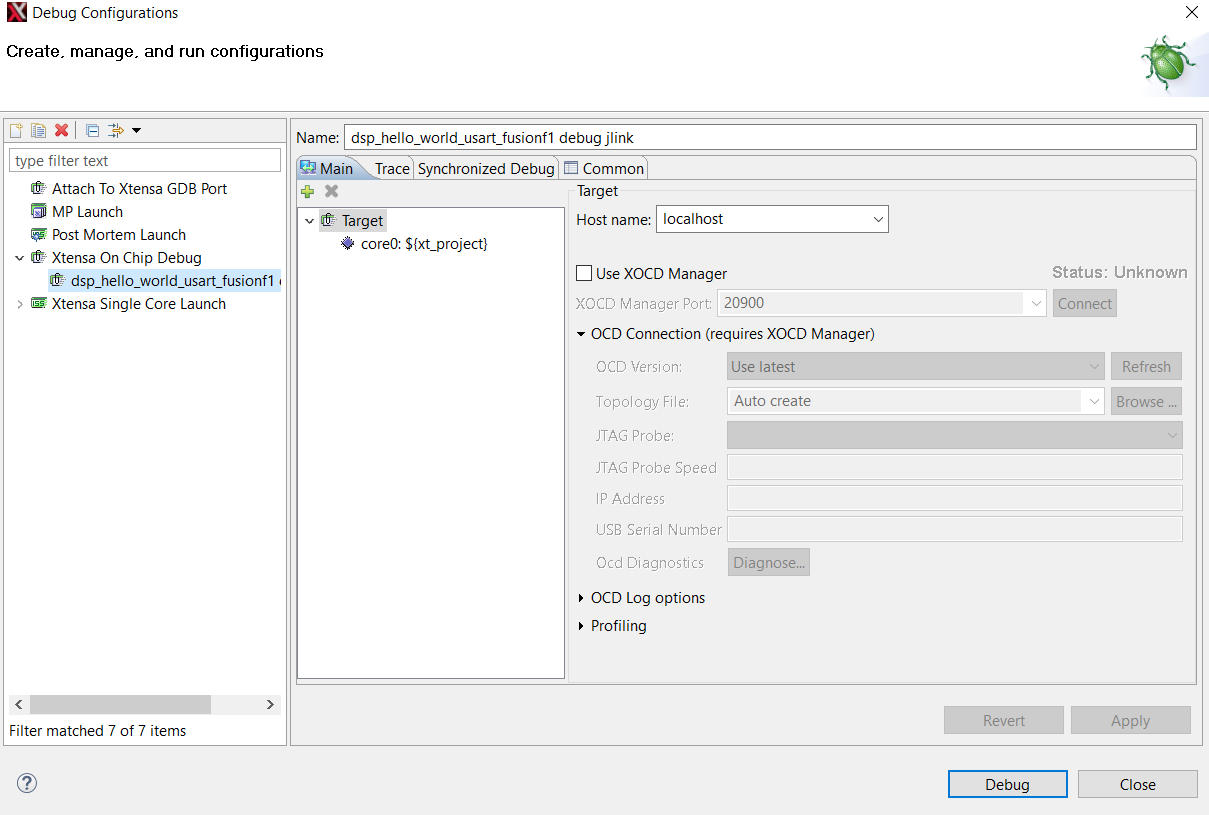
Once the Debug’ button is selected, the actual debug on the chip starts. Xplorer prompts you to download binaries to the hardware.
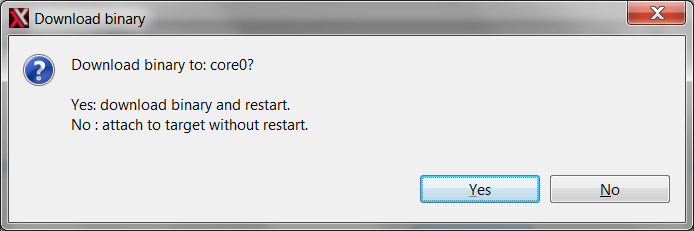
Select Yes.
Xplorer IDE transitions to the Debug perspective after binary download.
After stepping through the ‘printf’ statement, the output appears in the Console view of the IDE.
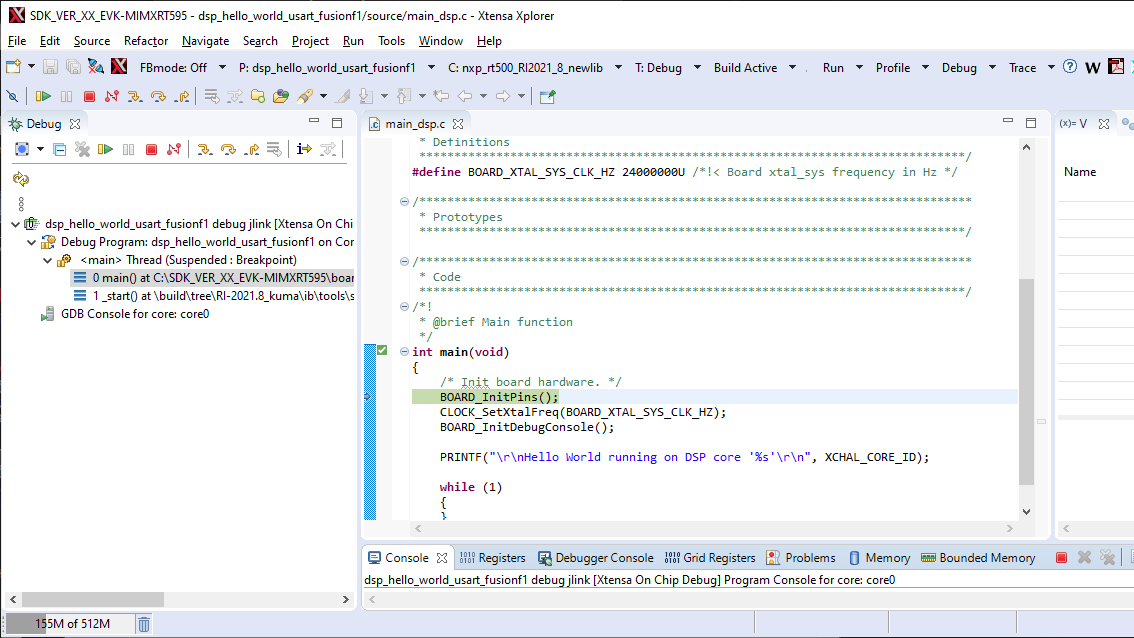
Hello World starts running on core
nxp_RT500_RI23_11_newlib.After the debug is complete, select the previous code perspective to return to the default IDE layout.

Parent topic:Run and Debug DSP Demo using Xplorer IDE
Run and Debug DSP Audio Framework
The DSP audio framework demo consists of separate applications that run on the Arm core and DSP core. The Arm application runs a command shell and relays the input requests to the DSP application using RPMsg-Lite.
EVK Board Setup for Audio Demo
The DSP audio demo is tested against EVK-MIMXRT595 and requires the CODEC line out (J4), and UART for serial console.
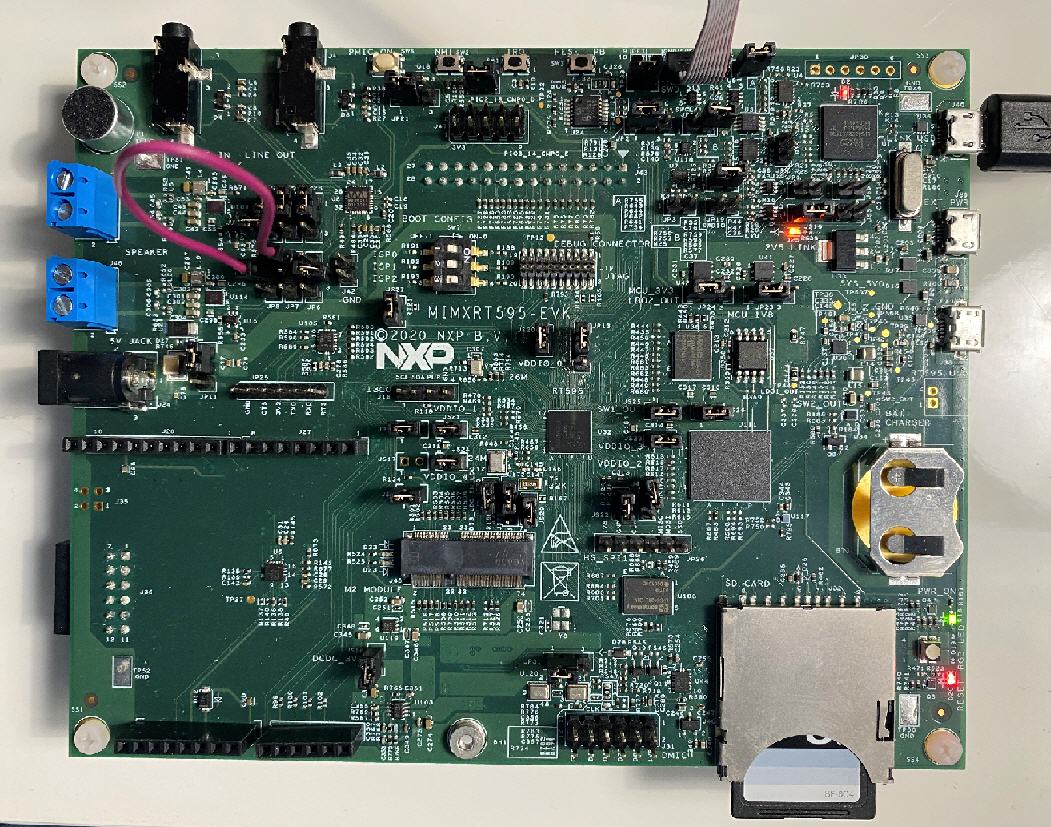
In order for the CODEC to output audio properly, you must attach two jumpers on the board as follows:
JP7-1 is connected to JP8-2
The demo uses the UART for console input and output. Connect the EVK board to a PC via the USB debug interface (J40) and open up a serial interface on your PC using a terminal tool such as Tera term or PuTTY on Windows or screen on Linux.
Remove Jumpers JP17, JP18, JP19 for SWD to connect to the chip and Serial interface on J40.
DSP debugging is through SWD only, so connect J-Link to SWD interface.
Parent topic:Run and Debug DSP Audio Framework
Debug Audio Demo
To debug this DSP application, first set up, and execute the Arm application using an environment of your choosing (see ‘Getting Started with MCUXpresso SDK for EVK-MIMXRT595.pdf’ for Arm development environment options).
The example that follows uses NXP MCUXpresso IDE for the Arm environment.
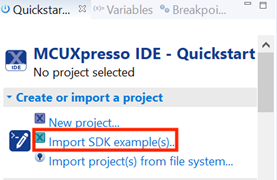
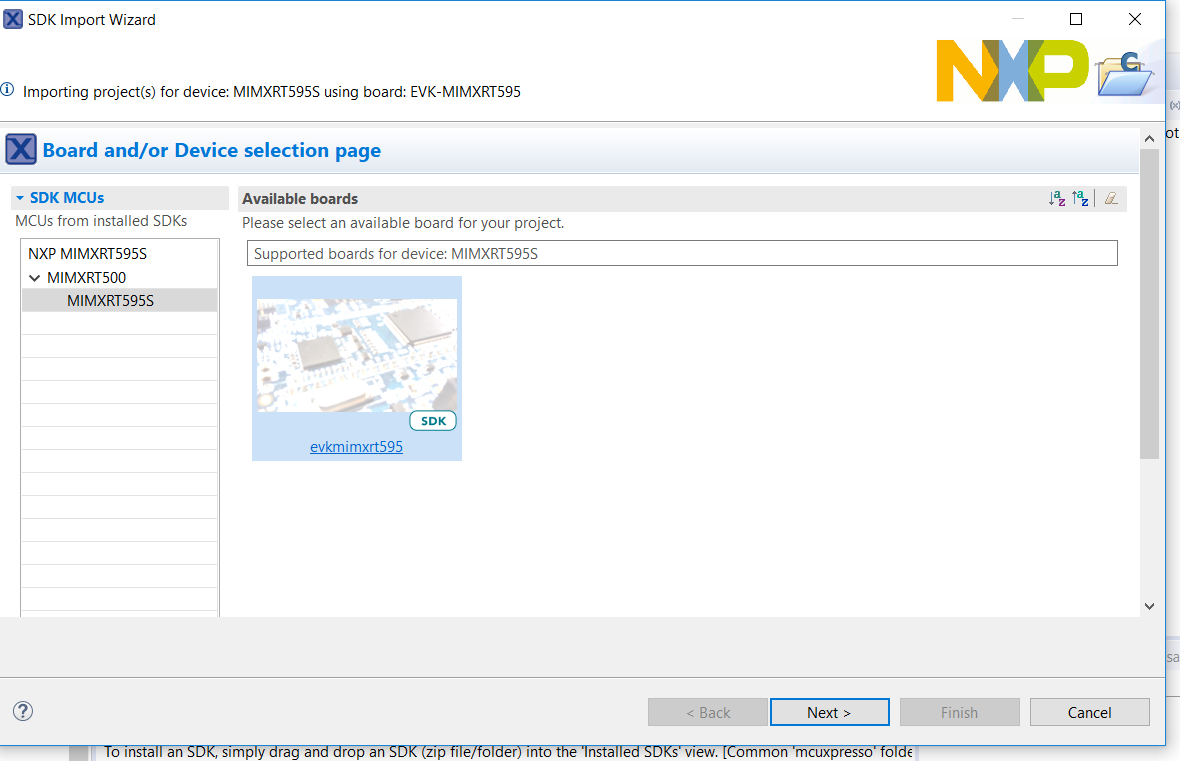
Install the MCUXpresso SDK for RT500 into the MCUXpresso IDE using the ‘Installed SDKs’ panel at the bottom:
Use the QuickStart menu on the lower left of the screen to import an example from the installed SDK.
Select the ‘dsp_xaf_record_cm33’ example for Cortex-M33 core.
Select UART in project options after clicking the dsp_xaf_record_cm33 example project.
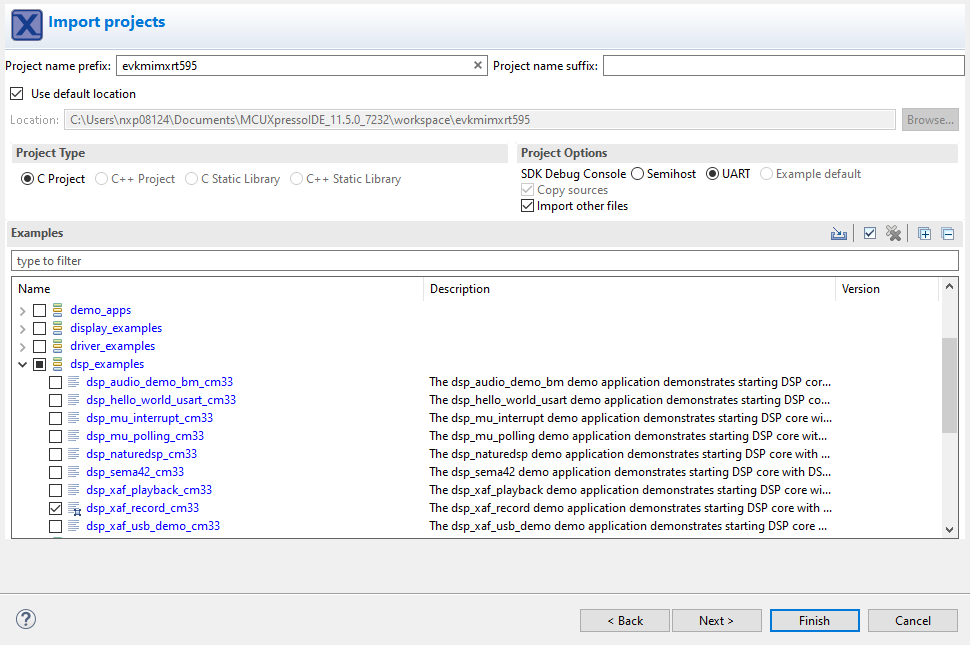
Select ‘Finish’ to complete the import.
Build the project and launch the debugger on success.
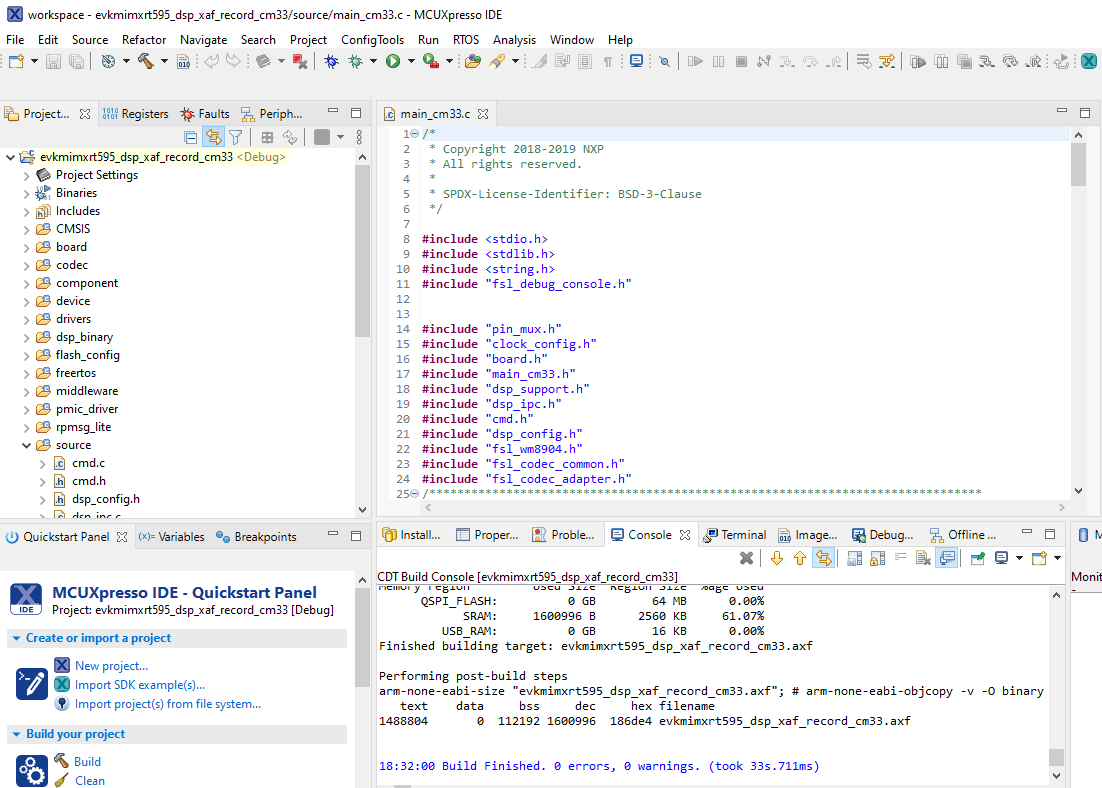
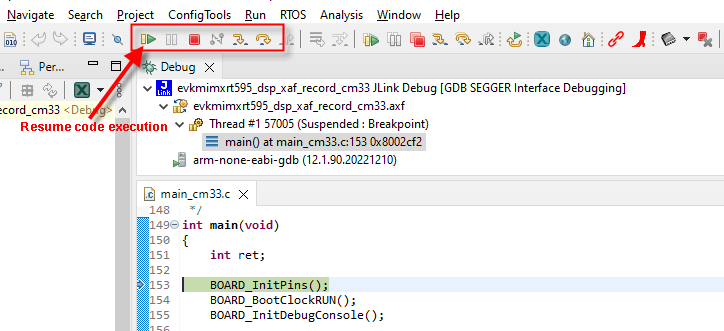
Use the debug toolbar to resume the code execution.
Observe serial terminal output with shell prompt:
******************************
DSP audio framework demo start
******************************

[CM33 Main] Configure WM8904 codec

[DSP_Main] Cadence Xtensa Audio Framework
[DSP_Main] Library Name    : Audio Framework (Hostless)
[DSP_Main] Library Version : 3.2
[DSP_Main] API Version     : 3.0

[DSP_Main] start
[DSP_Main] established RPMsg link
[CM33 Main] DSP image copied to DSP TCM
[CM33 Main][APP_DSP_IPC_Task] start
[CM33 Main][APP_Shell_Task] start

Copyright  2022  NXP
In the Xplorer IDE, load and execute
xaf_recordusing the procedure described in sections 3.4 and 3.5 of this document.After the DSP application runs, use the serial shell to invoke the
record_dmic [language]command. For information on supported language, check the VIT ReleaseNotes.txt. Using the serial shell creates an audio pipeline that captures microphone audio, perform voice recognition (VIT), and playback via the codec speaker line out (J4 on the EVK).>> help "help": List all the registered commands "exit": Exit program "version": Query DSP for component versions "record_dmic": Record DMIC audio , perform voice recognition (VIT) and playback on codec USAGE: record_dmic [language]
For voice recognition, say the supported wake-word and in 3 s say the frame-supported command. If selected model contains strings, then the wake-word and list of commands appear in the console.
Note: This command does not return to the shell.
The VIT wake-word and supported commands appear in the serial terminal.
See the readme.txt for jumper settings on the board as shown below.
Parent topic:Run and Debug DSP Audio Framework
Parent topic:Run and Debug DSP Demo using Xplorer IDE
Launch DSP Application from Arm Core
In the previous example, the Arm application and DSP application were independently loaded and debugged. This section shows how to produce an Arm application binary that includes and starts the DSP application without the use of a debugger/loader.
The Arm core application for each DSP demo uses a global preprocessor macro to control loading of the DSP binary application:
DSP_IMAGE_COPY_TO_RAM
This macro is set to 1 by default. When this macro is set to ‘1’/TRUE, it instructs the DSP demo application to do the following:
Link the DSP application binary images into the Arm binary
Copy the DSP application images into RAM on program boot
Initialize the DSP to run from the RAM image
Note: Ensure that this macro is supplied to both the C compiler and assembler when modifying the Arm project.
To build the DSP application image so it can be used by the Arm application, you must select the ‘Release’ target in Xplorer IDE (building with min-rt LSP – see section 2.4 for more information).

Three DSP binaries are generated.
<SDK_ROOT>\boards\evkmimxrt595\dsp_examples\xaf_record\dsp\binary\**dsp\_text\_release.bin**
<SDK_ROOT>\boards\evkmimxrt595\dsp_examples\xaf_record\dsp\binary\**dsp\_data\_release.bin**
<SDK_ROOT>\boards\evkmimxrt595\dsp_examples\xaf_record\dsp\binary\**dsp\_reset\_release.bin**
Note: Depending on the environment used, you may need to manually copy these binary images into your Arm application workspace.
Parent topic:Run and Debug DSP Demo using Xplorer IDE